Figure 5 on – Echelon LonScanner FX Protocol Analyzer User Manual
Page 16
10
Introduction to the LonScanner Protocol Analyzer
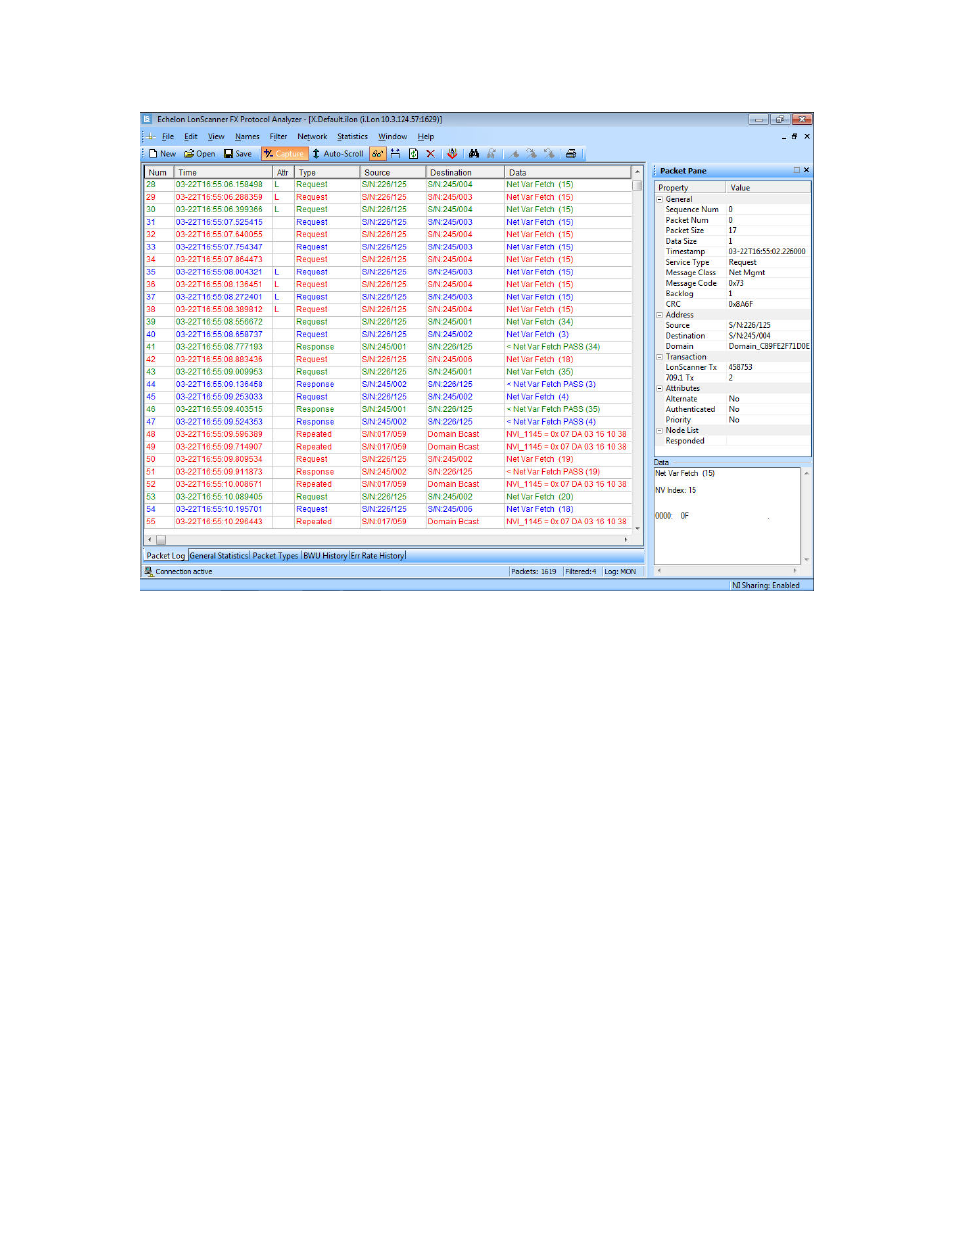
Figure 5. Main LonScanner Window
The main window includes the following three main areas:
• The Packet Log tab comprises the majority of the main LonScanner
window. The Packet Log tab contains a series of log entries, one for each
packet that the protocol analyzer collects from the channel. The log
entries are listed sequentially by timestamp. See the online help for
descriptions of the data fields listed for each packet.
While you are actively monitoring a channel, you can also select the
General Statistics, Packet Types, Bandwidth Utilization History, and
Error Rate History tabs at the bottom of the window to view statistics
collected from the channel during your log session. For more information
on these tabs, and for information about how you can configure the
protocol analyzer’s behavior during an active log session, see Chapter 2,
, on page 15.
• The Packet Detail pane to the right of the Packet Log tab lists detailed
information about the packet that is currently selected (if any) in the
Packet Log. Click a packet in the Packet Log to select it and view its
details in the Packet Detail pane. See the online help for descriptions of
the data fields listed for each packet in the Packet Detail pane.
• The menus and toolbar at the top of the window allow you to determine
how the protocol analyzer collects data from the channel and to organize
and analyze the data after it has been collected. For an overview of the
features provided by each menu, see
on
page 11.