B&G Deckman User Manual
Page 90
Speed Test
5.13
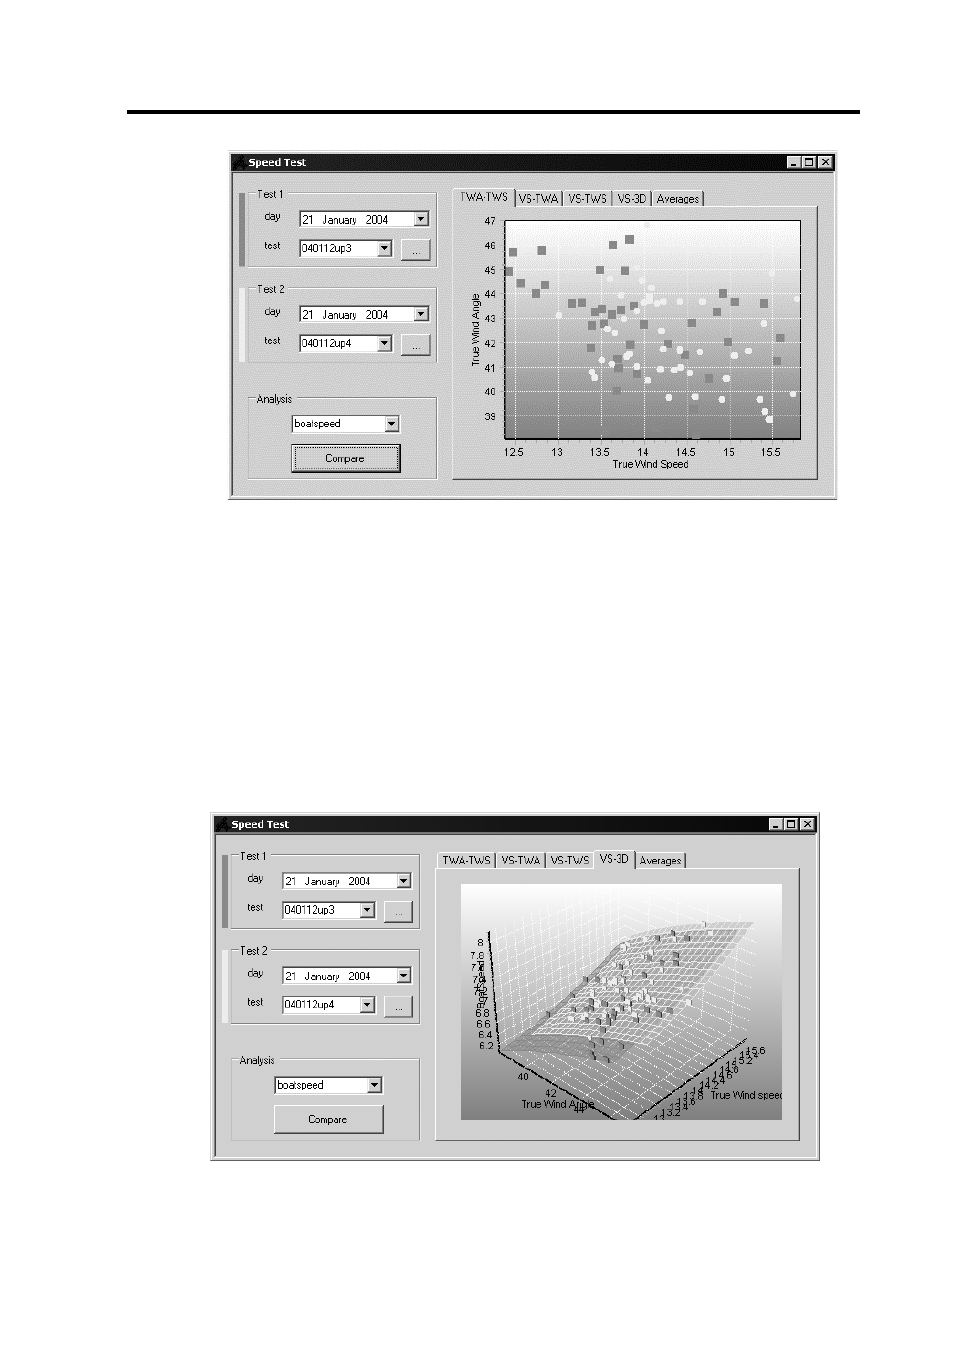
Use the TWS-TWA plot to confirm that you have selected the correct
tests, or that the data is suitable for comparison. You can then select any
of the other tabs at the top of the display to see the other pages, which
are all based on the 3-dimensional graph VS-3D, an example of which is
shown in Figure 5.8. You can click and drag anywhere on the plot to
move the 3D graph to assist you in seeing different areas.
The VS-TWA tab brings up a plot of boat speed against TWA, as
illustrated in Figure 5.9.
Figure 5.7
Figure 5.8