The result – B&G Deckman User Manual
Page 75
Chapter 4: Start display
4.10
The result
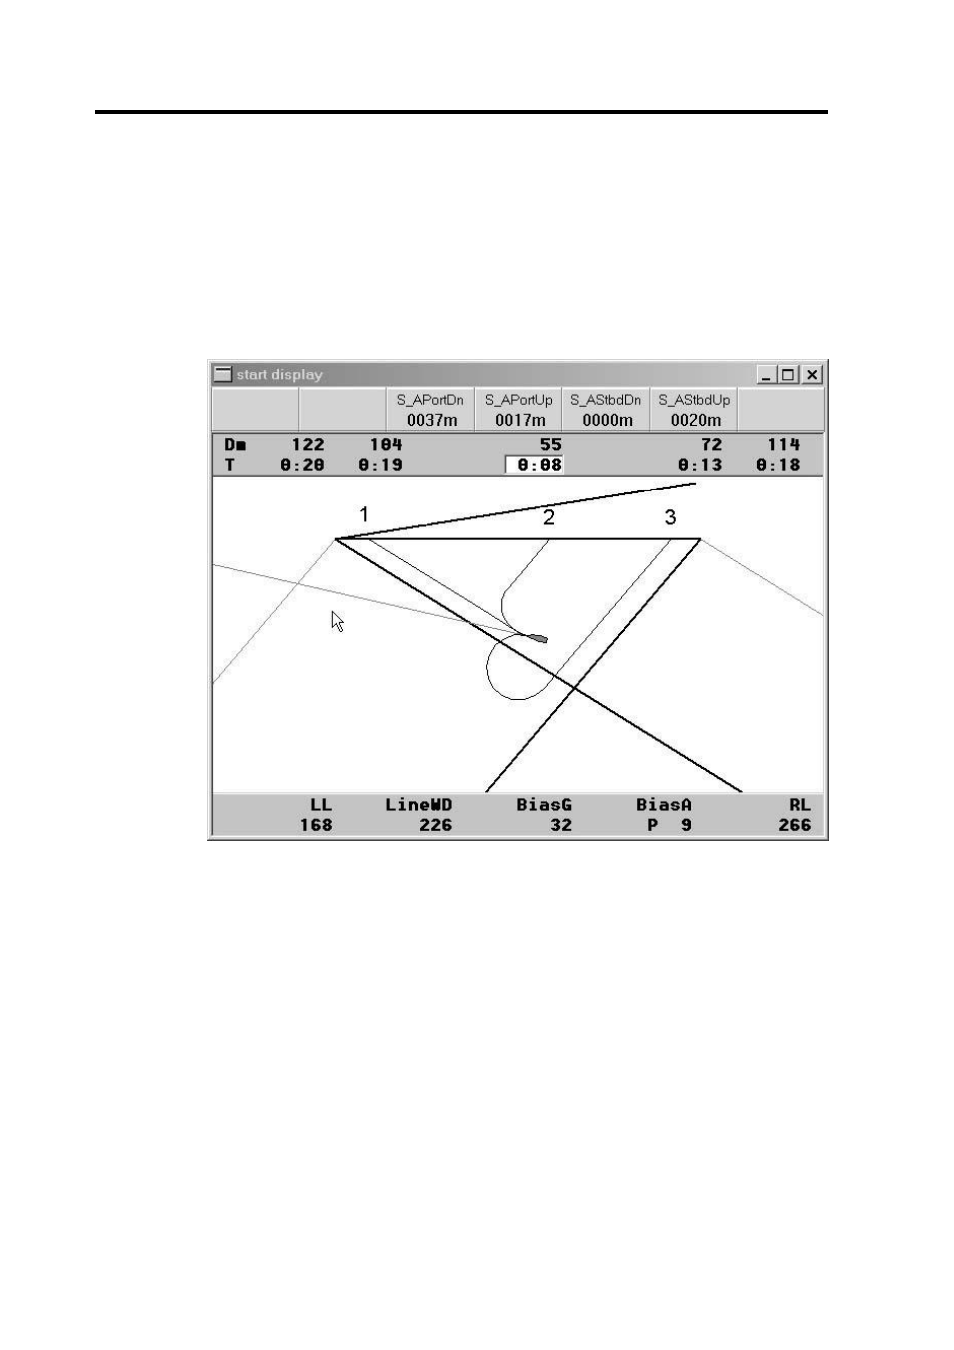
If you have both the rateofturn.d and timetospeed.d files, Deckman
will incorporate the predictions here into the Start display calculations
and will draw the relevant curves for these turns on the Start display, as
shown in Figure 4.7.
You can see the faint straight line from the front of the boat, and three
slightly heavier lines, which represent the projected track if the boat
turns according to your predictions. You can see that, in the example,
there are 3 possibilities for where these lines meet the start line
depending on which way the yacht turns.
In the data bar in the example, you can see that there are four variables
shown. These are the times to reach the start line on either tack, and
turning either up or down wind. The meanings of the four possibilities
are:
Figure 4.7