Wind forecasts – B&G Deckman User Manual
Page 141
Chapter 9: Wind and current forecasts
9.14
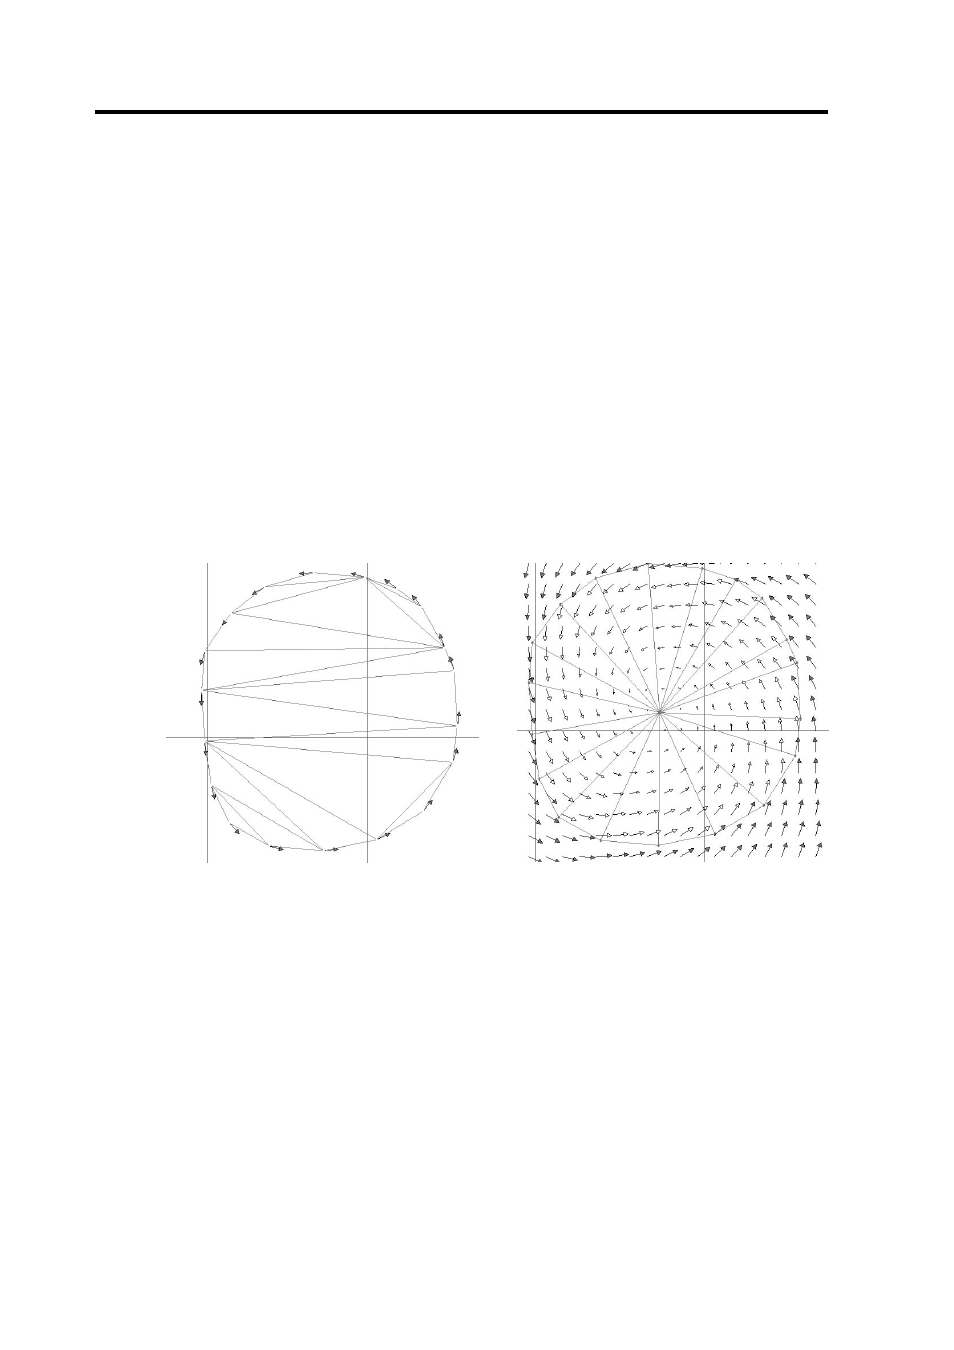
Figure9.9
Figure 9.8
the 'click and drag' method outlined above) than the distance between
lines.
Wind forecasts
When creating wind forecasts, you will generally be working from some
conception of where you are expecting high and low pressure systems to
be situated, with differing strengths of wind relative to the positions of
these. In the Speed box, enter the wind speed which you expect at a
certain position and then draw a line connecting these positions. Note
that, following the rule outlined above, it is necessary to draw your line
into the wind. Figure9.9 might represent the beginning of ‘creating’ a
low pressure system in the northern hemisphere; a clockwise circle was
drawn to establish this pattern.
Here you can see Deckman automatically triangulating between the
points entered. As this stands, however, this would not give an accurate
wind forecast. Firstly, the wind arrows need to point in slightly towards
the centre of the low. To do this, select Actions>Group, click and drag
to draw around the complete section and then enter an offset (say –20°)
into the Rotate box. Secondly, the wind speed will decrease towards the
centre of the low. To simulate this, enter 0 into the Speed box at the
bottom of the display and click in the middle of the low to place a node
here. Turning the Preview on would show the wind forecast we have