Animation – B&G Deckman User Manual
Page 46
Planning
3.19
Figure 3.10
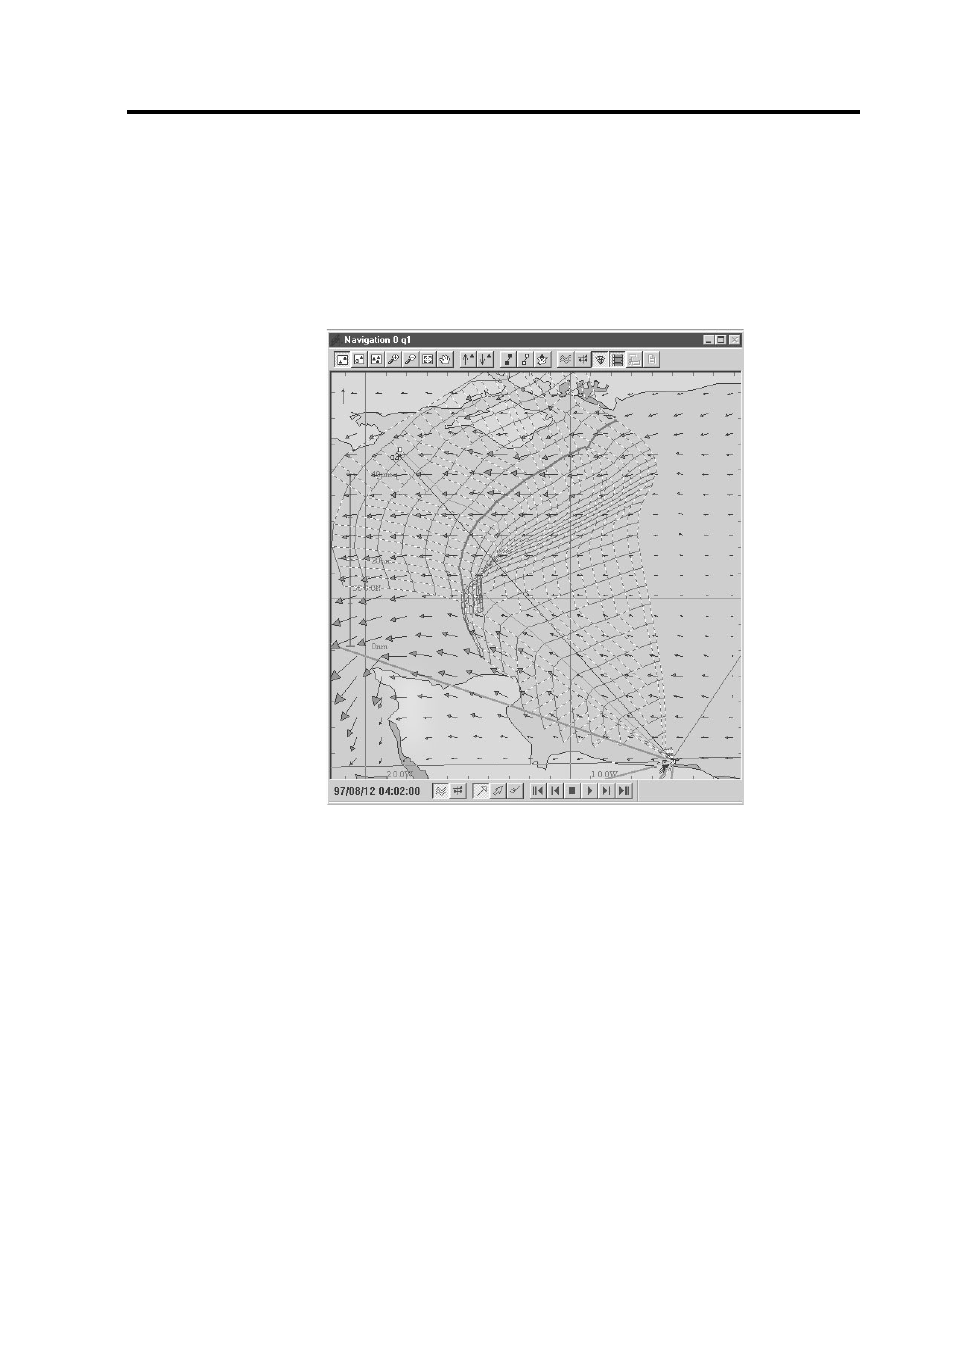
Animation
Clicking the animation icon on the tool bar allows you to move along
the route and view how the wind or current will change with time. In
Figure 3.10, you can see that in the bottom left corner, the date and time
the display is illustrating can be seen. The two buttons to the right of this
give you the option of viewing either current or wind (usual symbols,
see above). Three further buttons allow you a choice of what types of
vectors are used: always the arrows point in the direction of flow. For
the two arrows (left and middle), the size of the tip is proportional to the
speed; for the feathered pointers the number of feathers indicates the
rate—for wind one is equivalent to five knots, for tide one equals 1 knot.
For each, half feathers represent half the value.