Histogram – Banner PresencePLUS Pro COLOR—PROII Camera User Manual
Page 120
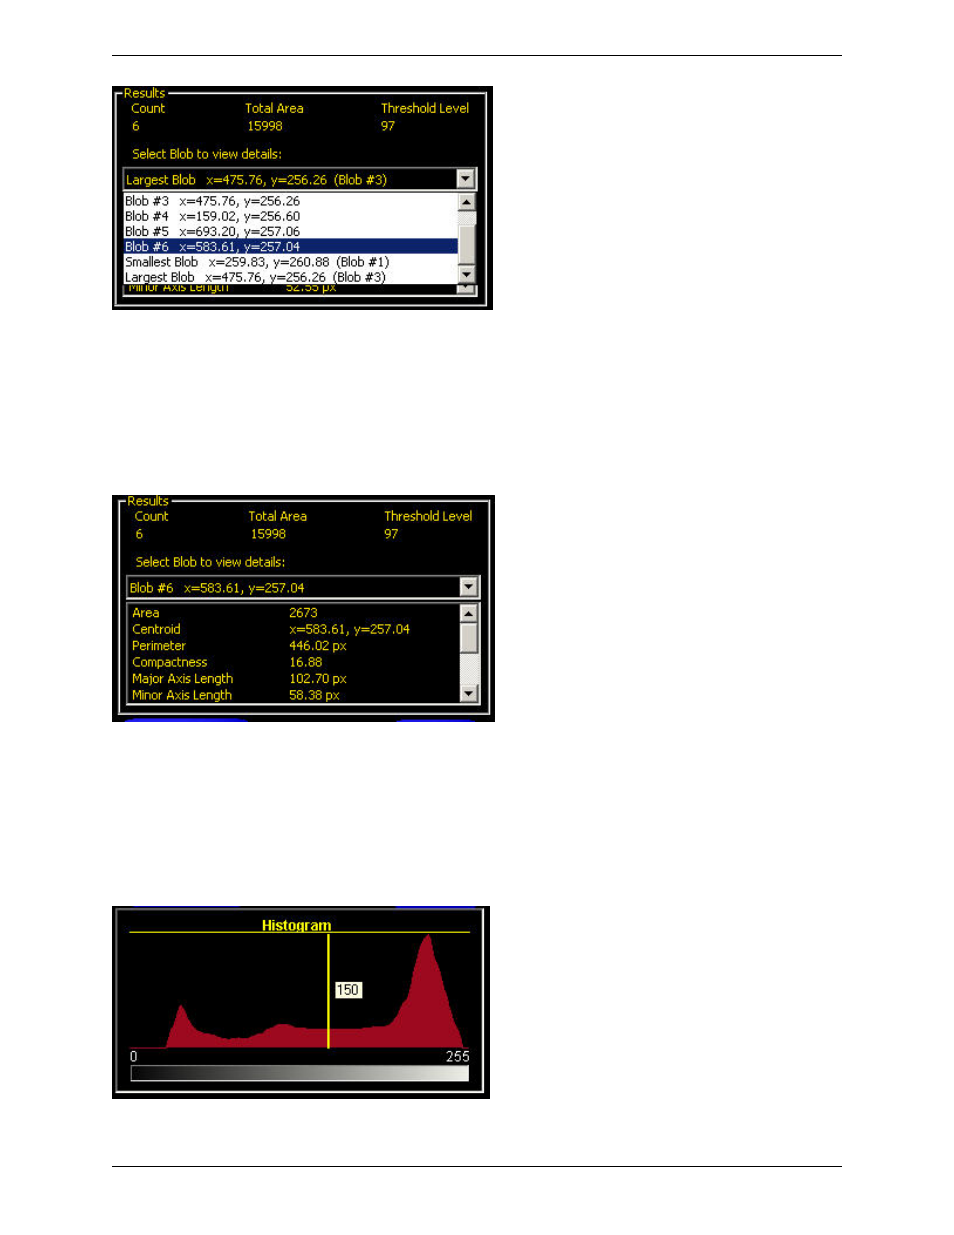
Count:
The number of Blobs found.
Total Area:
The total area (in pixels) of all the Blobs.
Threshold Level:
The white/black cutoff point.
From the dropdown list of Blobs, you can select a specific Blob to get area and centroid information about that specific
Blob.
Histogram
The Histogram is a display of the grayscale values on the "x" axis and the number of pixels on the "y" axis. The
Histogram displays the amount of pixels for each grayscale value. The graph displays information for all grayscale
values (0-255). Cursors, shown as vertical lines, represent minimum threshold, maximum threshold, threshold level
and reject level. Corresponding cursor can be moved horizontally to adjust a value.
Banner Engineering Corp.
Minneapolis, MN USA
120
2/2010
PresencePLUS Software Tools