1d analysis context menu commands – UVP Doc-It Life Science User Manual
Page 66
Performing 1D Analysis
61
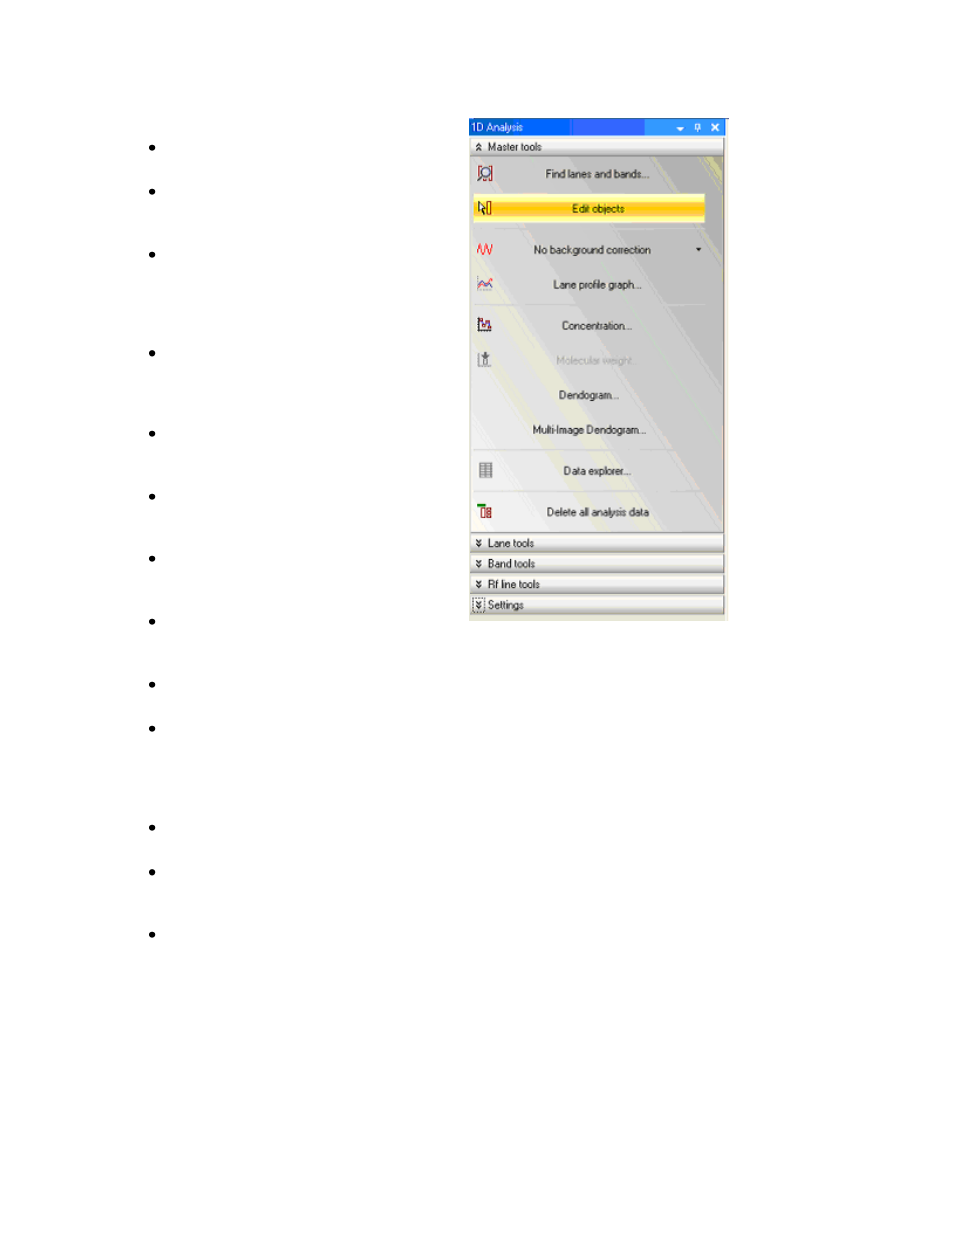
Find Lanes and Bands: Searches for
lanes and bands in the image.
Edit Objects: Select, move and resize
lanes, bands, Rf lines, and the Region
of interest (ROI).
No Background Correction: Corrects
the background with methods: No
Correction, Straight Line, Joined
Valleys, Rolling Disc and Area Between
Lines.
Lane Profile Graph: Displays a line
graph of intensity or concentration value
verses position in the lane for the lane
or lanes selected.
Molecular Weight: Calibrates molecular
weight with Retardation factor (Rf) lines
and by applying standards to lanes.
Dendrogram: Compares the statistics
of bands in one lane to bands in other
lane for a single image.
Multi-Image Dendrogram: Compares
the statistics of bands in one lane to
bands in other lane for multiple images.
Data Explorer: Brings up datasheets
showing the results of calculations on
lanes and bands.
Delete all analysis data: Deletes all
recorded analysis data.
Lane Tools: View Lane Properties, Add
lane(s), Delete selected lane(s), Find
bands in selected lane(s), Straighten
selected lane(s), Auto curve selected
lane(s).
Band Tools: View Band properties,
Add bands(s), Delete selected band(s)
Rf Line Tools: Add Rf line, Delete
selected Rf line(s), Delete all Rf lines,
Select standard lane
Settings: Sets image analysis settings.