Viewing the ieee 1159 statistics report – SATEC PM174 Manual User Manual
Page 116
Chapter 4 PAS Application Viewing
Recorded
Files
116
Series PM174 Powermeters
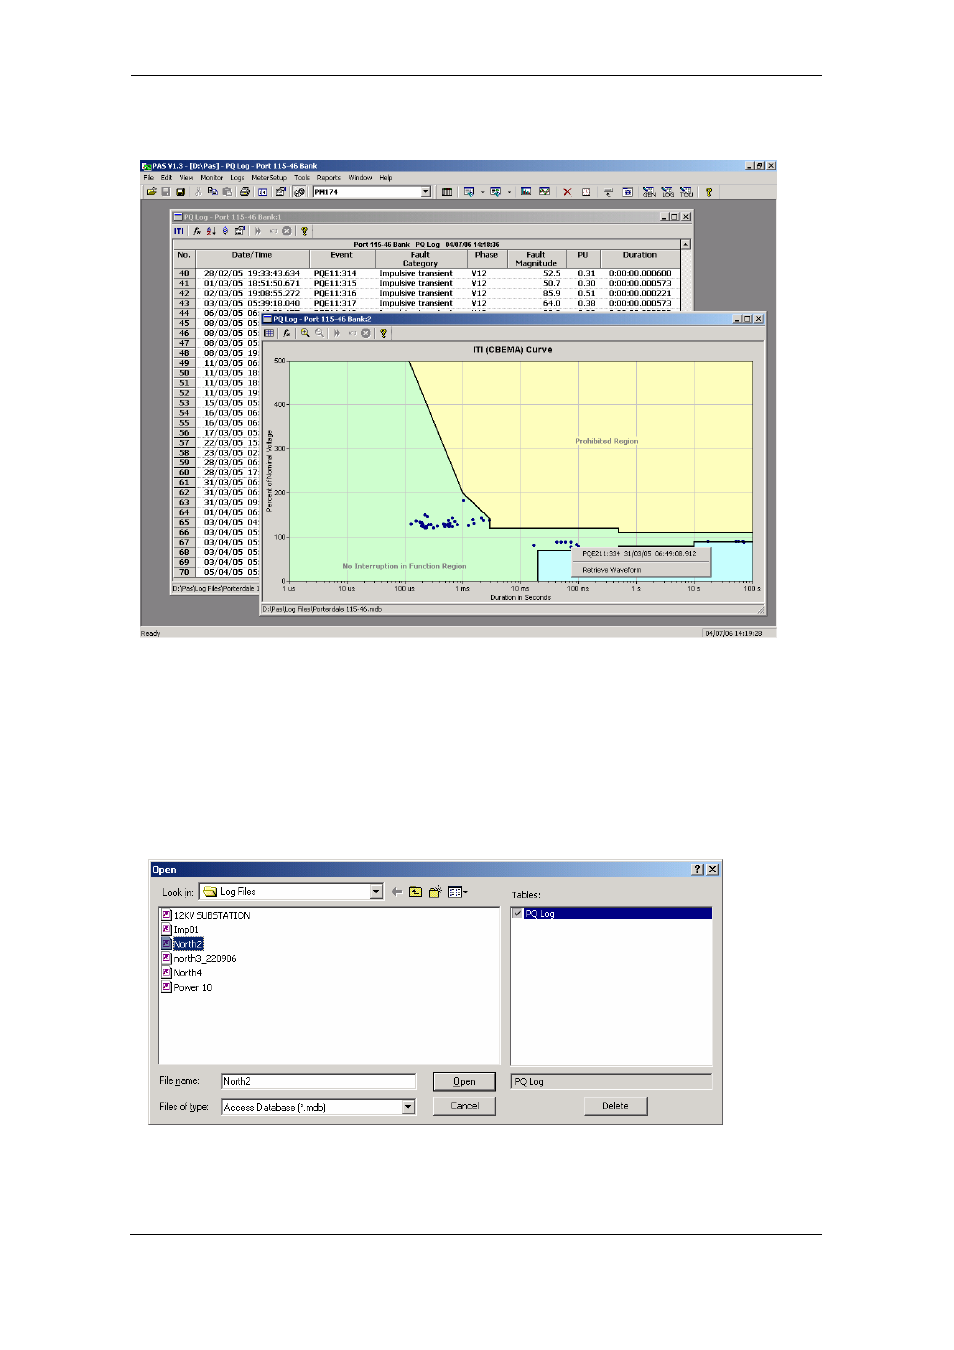
formerly CBEMA) curve chart. To view an ITI curve chart, click
on the “ITI” button on the window toolbar.
To view the event details, click on the event point with the left
mouse button. To directly move to the related power quality
report entry or to a waveform record, click on the
corresponding list item with the left mouse button.
Viewing the IEEE 1159 Statistics Report
To get an IEEE 1159 statistics report on the collected power
quality event data, select “IEEE 1159 Statistics” from the
Reports menu, point to the database where you stored the
retrieved power quality log data, and then click Open.
The following picture shows an example of the IEEE 1159
statistics report.