Viewing the device event log, Filtering and sorting events, Linking to waveforms and data records – SATEC PM174 Manual User Manual
Page 113
Chapter 4 PAS
Application Software
Viewing Recorded Files
Series PM174 Powermeters
113
PAS offers you different options for easy analysis of retrieved
trend and fault data. Data can be displayed in primary or
secondary units. You can use filtering to find out and work with
a subset of events that meet the criteria you specify, or use
sorting to rearrange records in the desired order. PAS can also
link events and the corresponding data records and
waveforms together to allow you more effective analysis of
recorded events.
See the “PAS Getting Started Guide” for more information on
viewing log files and available options.
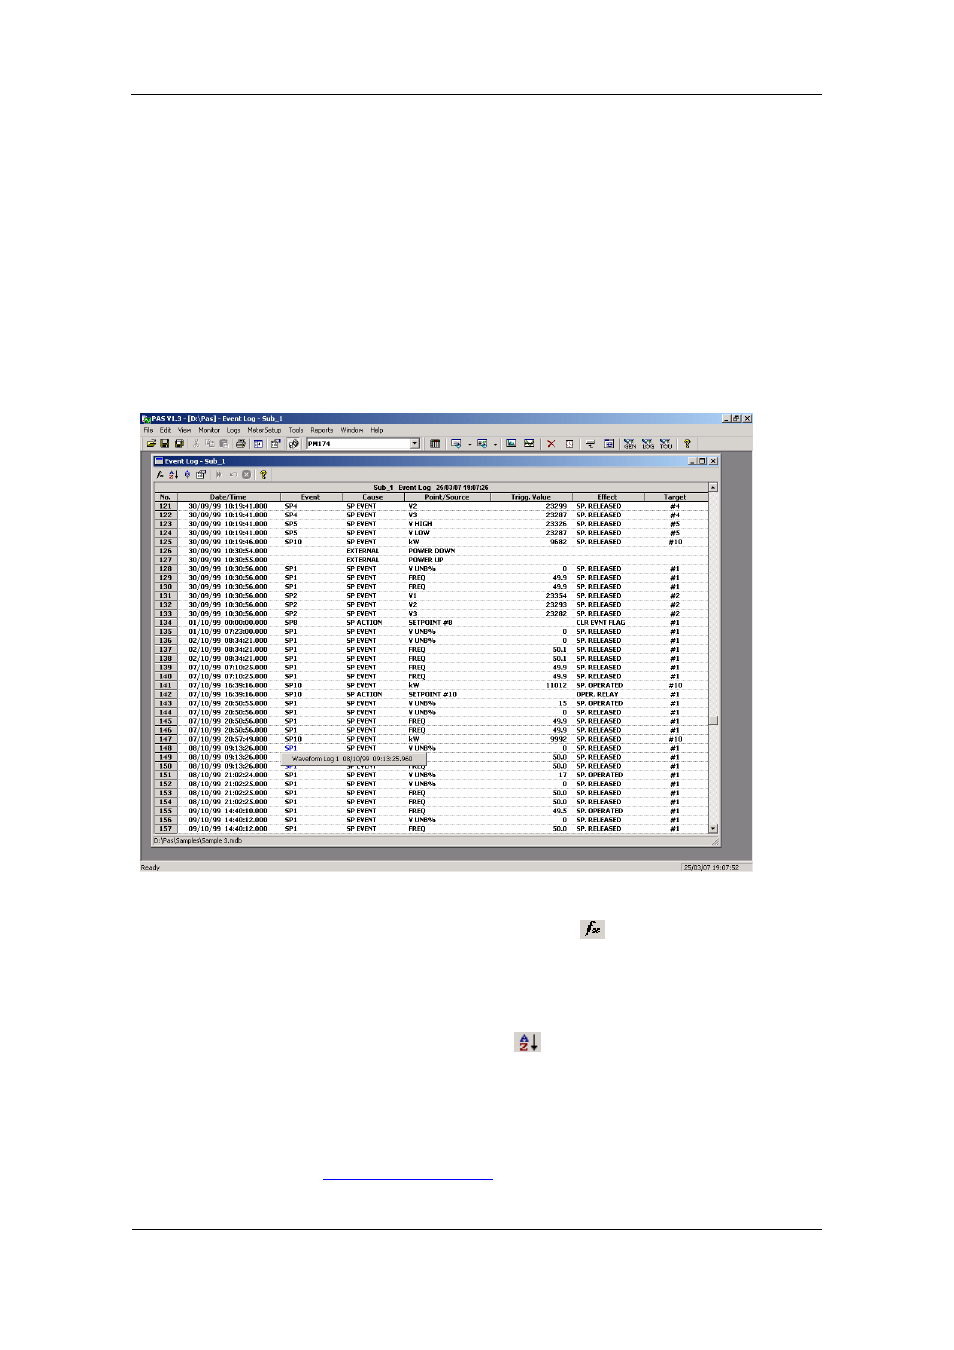
Viewing the Device Event Log
Event log files are displayed in a tabular view. PAS loads the
entire database table to a window, so that you can scroll
through the entire log to view its contents.
Filtering and Sorting Events
To filter events, click on the Filter button
, or click on the
report window with the right mouse button and select “Filter...”.
Check the causes of events you want to display, and then click
OK.
Event records are normally shown in the order based on the
date and time of the event appearance. To change the sorting
order, click on the Sort button
, or click on the report
window with the right mouse button and select “Sort...”, check
the desired sort order, and then click OK.
Linking to Waveforms and Data Records
If a setpoint triggers the Waveform or Data recorder and is
programmed to log setpoint events to the Event log (see
), then PAS automatically