Ransburg, Rcs-2 user manual - operation – Ransburg RCS 2 Ratio Control System User Manual
Page 47
The following variables can be graphed:
Trigger
Requested Ratio (2 channel guns only)
Actual Ratio (2 channel guns only)
Total Flow (for both channels together)
Requested Flow (for either or both channels)
Actual Flow (for either or both channels)
Inlet Pressure (for the pump on either or both
channels)
Outlet Pressure (for the pump on either or both
channels)
Hardener Flow
Setup:
Each of the 4 variables is graphed in a different
color: red, green, blue, or black. The order in which
the operator selects the variables determines in
which order they appear on the screen.
F1: Time Base – This button allows the user to
switch the time base (resolution) of the graph. In
fast mode, the full-screen width is graphed in 40
seconds. In slow mode, the full-screen width is
graphed in 80 seconds.
F2: Single Plot – This button allows the user to
record one full screen of data (40 or 80 seconds)
at which point the graphing stops to allow the user
to examine the data. In continuous data mode,
when the cursor reaches the right end of the graph,
it automatically jumps back to the left end of the
graph and writes over old data.
F3: Stop Plot – This button allows the user to
stop the data acquisition process temporarily and
freeze the display for analysis or to save the plot.
F4: Start Stop (<--) – This button allows the user
to move both the start-time cursor and the stop-
time cursor at the same time to the left.
F5: Start Time (<--) – This button allows the user
to move the start-time cursor to the left.
F6: Start Time (-->) – This button allows the user
to move the start-time cursor to the right.
Operator simply highlights the variables they wish
graphed and then pushes the F1 key to select
them. The selected variables will then show up in
the box in the lower left of the screen. Variables
can be removed by simply pushing the F3 button.
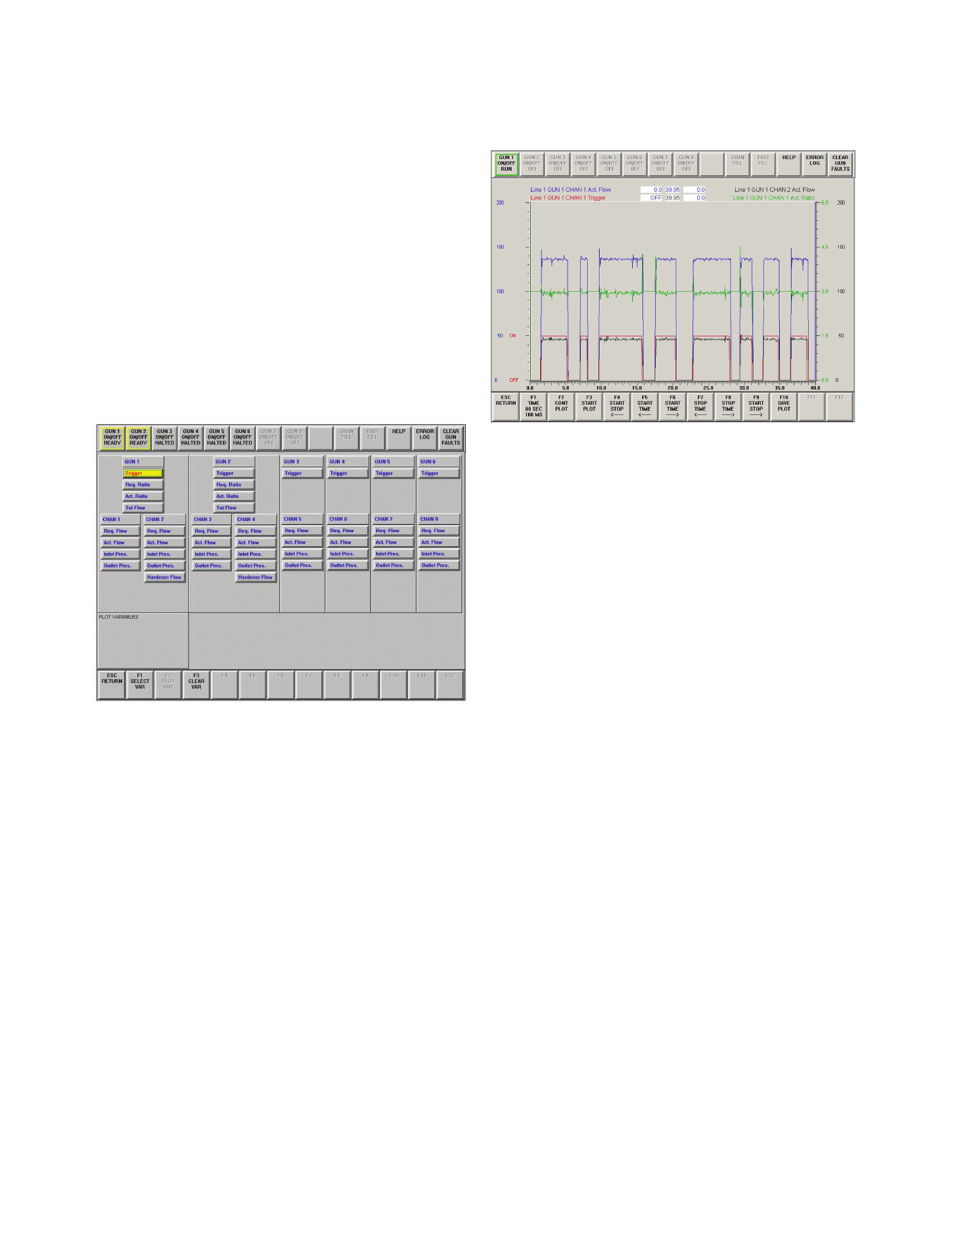
Selecting F2 will cause the graphed data to run
continuously. After a full screen of data has been
graphed, the screen is cleared and the graphing
restarts on the left end of the screen.
Graphing:
RCS-2 User Manual - Operation
44
LN-9407-00.2
Ransburg