Charts, Chart modes, Charts -2 – National Instruments BridgeVIEW User Manual
Page 241: Chart modes -2
Chapter 11
Loops and Charts
11-2
© National Instruments Corporation
Charts
A chart is a numeric plotting indicator which is updated with new data
periodically. You can find two types of charts in the Controls»Graph
palette: waveform chart (or real-time trend) and intensity chart. You can
customize charts to match your data display requirements or to display
more information. Features available for charts include: a scrollbar, a
legend, a palette, a digital display, and representation of scales with respect
to time. For more information about charts, see Chapter 15, Graph and
Chart Controls and Indicators, in your G Programming Reference
Manual.
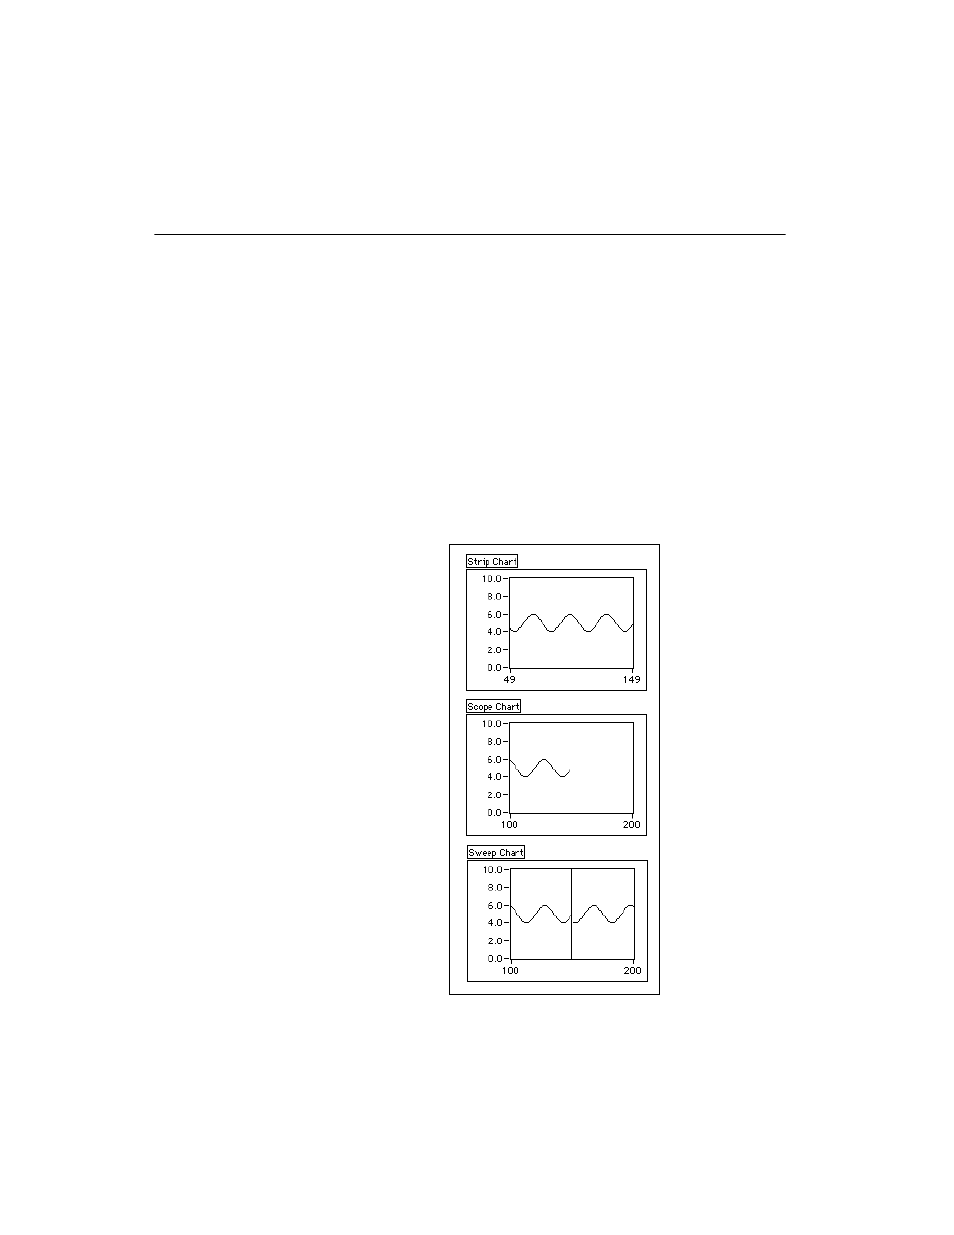
Chart Modes
The following illustration shows the three chart display options available
from the Data Operations»Update Mode submenu—Strip chart,
Scope chart, and Sweep chart. The default mode is strip chart.
- Instrument Driver NI-DMM (12 pages)
- 24-Bit Half/Full-Bridge Analog Input Module NI 9237 (36 pages)
- NI PXIe-8105 (76 pages)
- PXI NI 5401 (60 pages)
- Fieldpoint CFP-2210 (38 pages)
- NI 781xR (48 pages)
- NI 6233 (180 pages)
- 6508 PCI-DIO-96 (93 pages)
- PXI/CompactPCI Embedded Computer NI PXI-8108 (83 pages)
- NI 9233 (34 pages)
- NI USB-9219 (25 pages)
- GPIB-PC (262 pages)
- cFP-RTD-122 (15 pages)
- USB device 625x (23 pages)
- Isolated Analog Input Modules SCC-AI01 (18 pages)
- NI PCI-6111 (118 pages)
- NI USB-6008 (32 pages)
- PC-DIO-24 (75 pages)
- NI 9474 (31 pages)
- NI 6013 (109 pages)
- PXI-1428 (46 pages)
- NI PCI-5911 (51 pages)
- 2 SD Card Memory Module NI 9802 (16 pages)
- cFP-20xx (24 pages)
- NI USB-9234 (23 pages)
- NI 9871 (24 pages)
- Interface Device NI PCI-1426 (35 pages)
- AT E Series (184 pages)
- 9211A (19 pages)
- Module NI PXI-8250 (39 pages)
- 8330 Series (30 pages)
- NI PXIe-8360 (40 pages)
- Deterministic Ethernet Expansion Chassis NI 9144 (65 pages)
- NI 6509 (23 pages)
- NI MATRIXx Xmath (127 pages)
- NI 9481 (23 pages)
- Monochrome Image Acquisition Device NI 1410 (34 pages)
- VXI-1394 (74 pages)
- NI PXI-8104 (69 pages)
- NI 9235 (38 pages)
- 370620B-01 (17 pages)
- FP-RTD-124 (15 pages)
- VXI-USB (61 pages)
- NI PCI-8254R (45 pages)
- Interface Device NI PCI-8254R (16 pages)