Profile measurements – HEIDENHAIN IK 5494-2D User Manual
Page 187
5
Measuring
165
Profile fit results include:
• X: The x-axis offset after shifting the data cloud to achieve the best fit.
• Y: The y-axis offset after shifting the data cloud to achieve the best fit.
• a: The angular offset after shifting the data cloud to achieve the best fit.
• F: The form error
• #: The number of points acquired, and the number of points used to determine profile fit results.
• T: The tolerance Pass/Fail result.
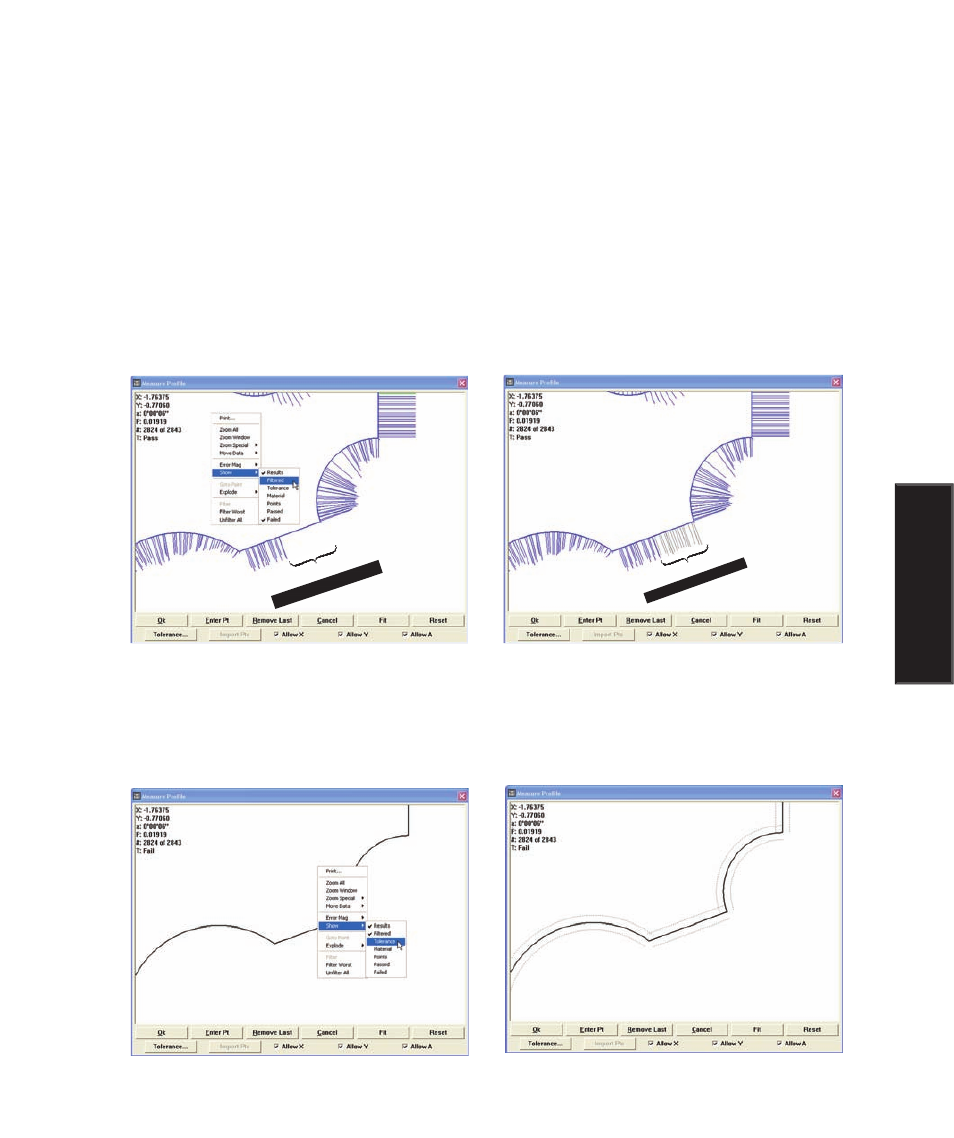
Filtered
Click the Show/Filtered menu item or toolbar icon to display points and error whiskers that were filtered
earlier using the Filter or Filter Worst profile menu command. Filtered points appear as dark gray.
Tolerance
Click the Show/Tolerance menu item or toolbar icon to display dotted lines that indicate the tolerance
zones around profile edges specified earlier using the Tolerance button in the Measure profile window.
Click Show/Filtered...
To display previously hidden data
Click Show/Tolerance...
to display tolerance zones
Profile Measurements