Trip log table view – DAVIS CarChip Online Help (8221, 8226, 8245, 8246) User Manual
Page 76
CarChip Online Help Printable Version
The following mouse commands are available in Trip Log Plot view:
Left Button Commands:
The following commands are available using the Left Mouse button:
Zoom
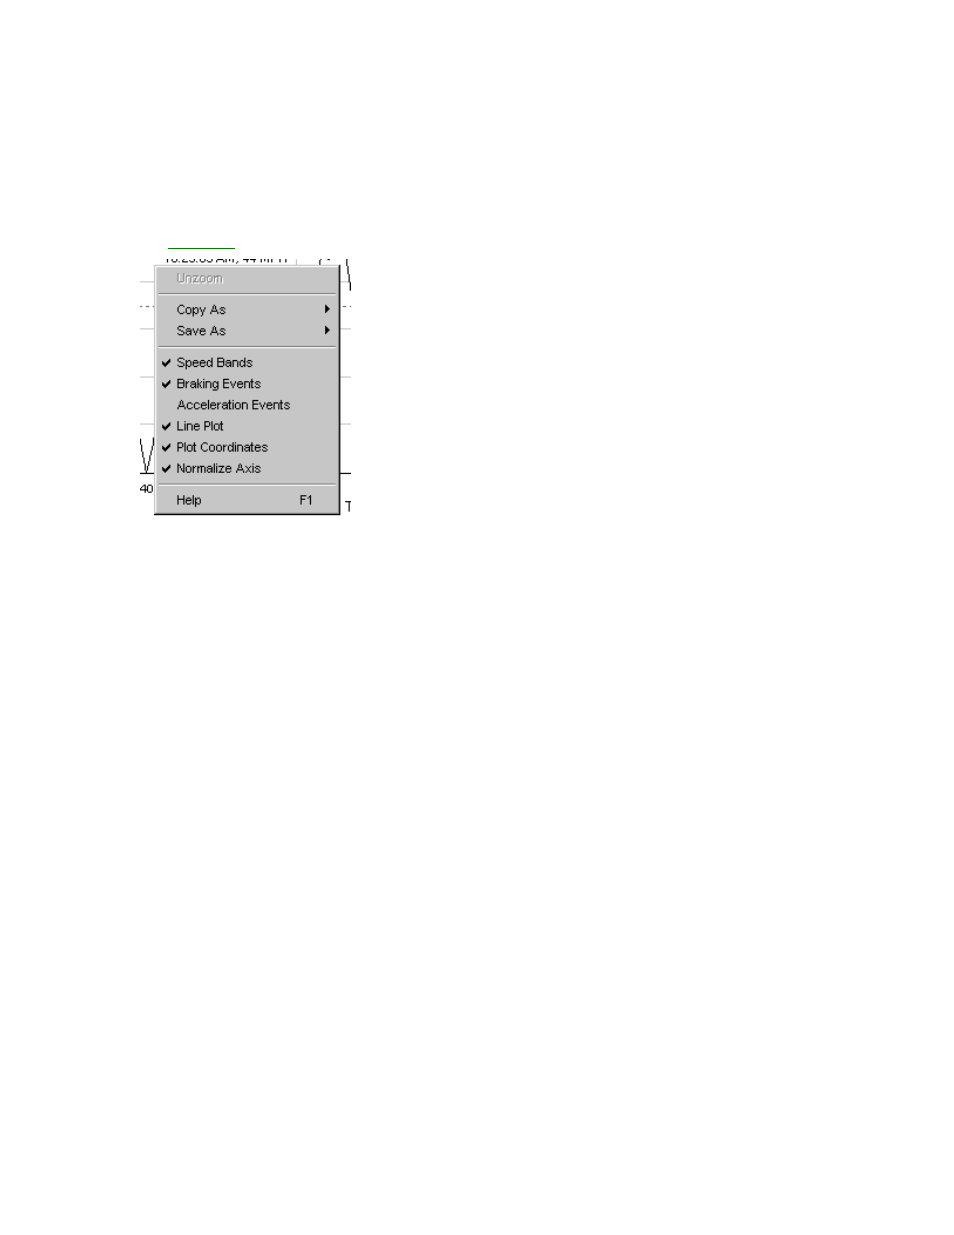
Right-Click Menu Commands:
The
Right-Click
Menu commands are available in the Trip Log Plot view:
•
Unzoom
•
Copy As
•
Save As
•
Speed Bands - Select to include horizontal lines indicating speed band settings.
•
Braking Events - Select to draw vertical lines indicating braking events that exceed a braking
threshold.
•
Acceleration Events - Select to include vertical lines indicating acceleration events that exceed an
acceleration threshold.
•
Line Plot - Select to draw plots using plain lines. If not selected the area under the lines is filled in
with black.
•
Plot Coordinates - Select to display the cursor coordinates inside the plot view window.
•
Normalize Axes - Select to use the same upper speed range for all Speed Plots. The upper end of
the speed range is set in the Setup / Plots dialog box. Click the Options button in the plot window
to change the upper speed range.
•
Help F1
Back to Trip Log Plot View
Home | File | Setup | CarChip | Tools | View | Help | Shortcuts
Trip Log Table View
The Trip Log Table view displays the all the values, including vehicle speed and any other selected
parameters, that were sampled by the CarChip data logger through the duration of the trip.
72