Draw acceleration events, Draw plots as lines – DAVIS CarChip Online Help (8221, 8226, 8245, 8246) User Manual
Page 37
Welcome to CarChip
3. Click OK to save the new plot setup. Click Cancel to exit the dialog box and retain the previous plot
setup. Click Apply to make the change without exiting the dialog box.
Back to Setup Menu
Home | File | Setup | CarChip | Tools | View | Help | Shortcuts
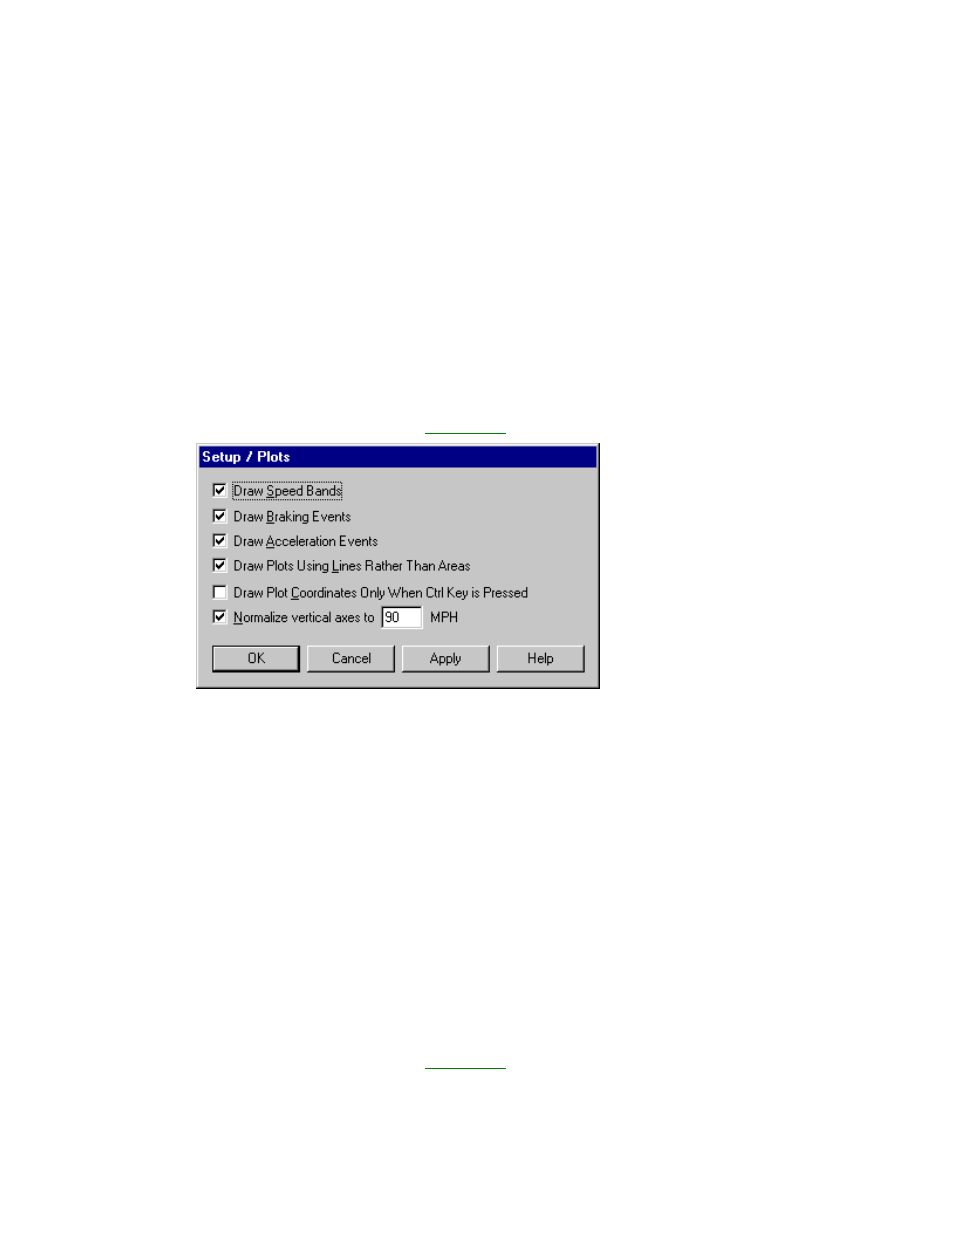
Draw Acceleration Events
The Draw Acceleration Events check box in the Setup / Plots dialog box displays any hard and
extreme acceleration events in the Trip Log Plot view when selected. The thresholds for hard and extreme
accelerations are set in the Set Acceleration Thresholds dialog box.
If the Draw Acceleration Events box is selected from the Setup / Plots dialog box, the acceleration
events are represented by blue vertical lines. A hard acceleration event is a dotted blue vertical line. An
extreme acceleration event is a solid blue vertical line.
To display acceleration events in the plots:
1. Select Plots from the Setup menu. The
Setup / Plots
dialog box displays.
2. Click the Draw Acceleration Events check box to toggle the function on and off. A check indicates
that the Draw Acceleration Events function has been enabled.
3. Click OK to save the new plot setup. Click Cancel to exit the dialog box and retain the previous plot
setup. Click Apply to make the change without exiting the dialog box.
Back to Setup Menu
Home | File | Setup | CarChip | Tools | View | Help | Shortcuts
Draw Plots As Lines
The Draw Plots As Lines check box in the Setup / Plots dialog box displays the trip and plot
information in lines in the Trip Log Plot view when selected.
If the Draw Plots As Lines box is selected from the Setup / Plots dialog box, the plot information is
displayed as a black line. If the Draw Plots As Lines box is toggled off, the area under the plot line is
filled black.
To display lines in the plots:
1. Select Plots from the Setup menu. The
Setup / Plots
dialog box displays.
33