QOMO QClick V7 User Manual
Page 27
Copyright © 2012 All Rights Reserved by QOMO HiteVision.
www.qomo.com
27
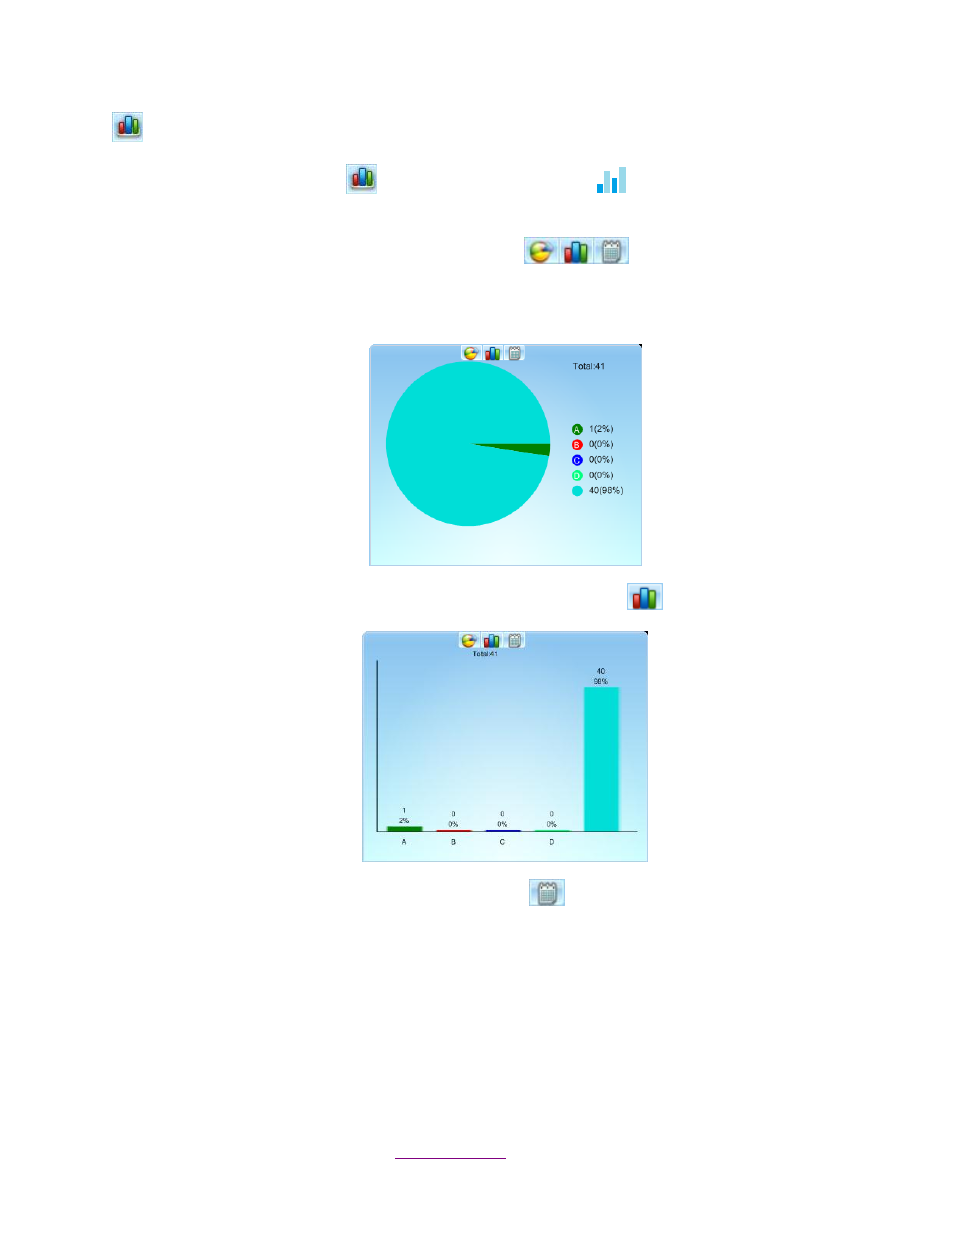
Result: Show response result in a graph.
By pressing the Result button
, or on the instructor remote
, the instructor can view the
responses to the individual quiz questions. Results are displayed in graphs.
The user can change the graphs through the buttons
displayed on the top of the
graph window or by pressing F1 key on the instructor remote.
The pie chart is the default chart.
The graph can be changed to a histogram by pressing the chart button
.
Answer details can be viewed by pressing the grid button
.