Casio CLASSPAD 330 3.04 User Manual
Page 99
20060301
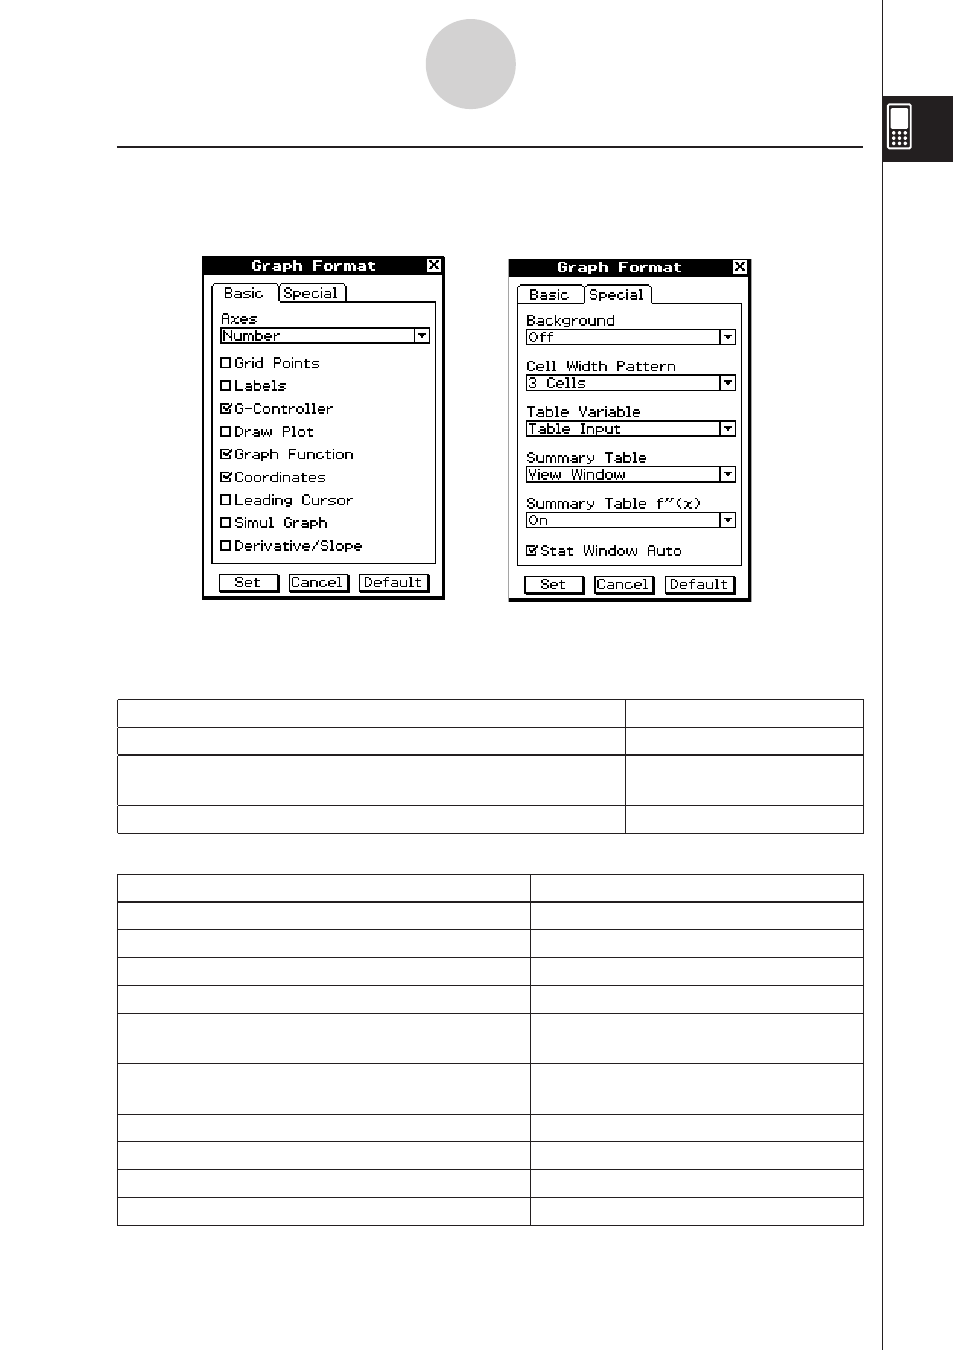
I Graph Format Dialog Box
Use the Graph Format dialog box to configure settings for the Graph window and for drawing
graphs.
1-9-6
Configuring Application Format Settings
Basic Tab
S Axes
To do this: Select
this setting:
Turn on display of Graph window axes
On*
Turn on display of Graph window axes along with maximum
and minimum value of each axis
Number
Turn off display of Graph window axes
Off
S Other settings
To do this:
Do this:
Turn on display of Graph window grid
Select the [Grid Points] check box.
Turn off display of Graph window grid
Clear the [Grid Points] check box.*
Turn on display of Graph window axis labels
Select the [Labels] check box.
Turn off display of Graph window axis labels
Clear the [Labels] check box.*
Turn on display of graph controller arrows during
graphing
Select the [G-Controller] check box.
Turn off display of graph controller arrows during
graphing
Clear the [G-Controller] check box.*
Draw graphs with plotted points
Select the [Draw Plot] check box.
Draw graphs with solid lines
Clear the [Draw Plot] check box.*
Turn on display of function name and function
Select the [Graph Function] check box.*
Turn off display of function name and function
Clear the [Graph Function] check box.