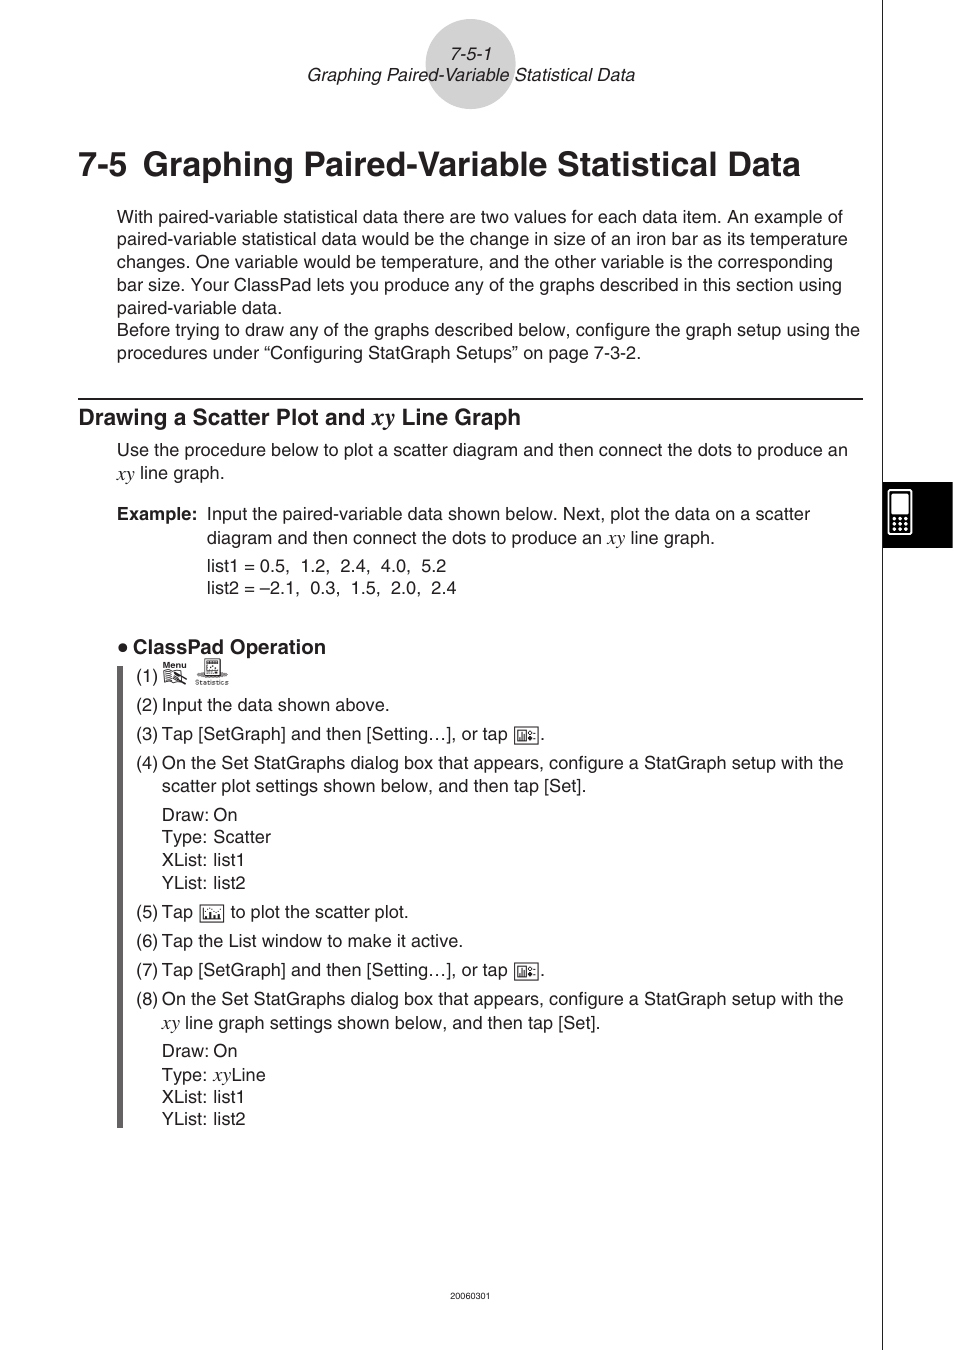
5 graphing paired-variable statistical data, 5 graphing paired-variable statistical data -5-1, Drawing a scatter plot and – Casio CLASSPAD 330 3.04 User Manual
Page 400: Line graph -5-1
This manual is related to the following products:

