Ilar to, Figure 3-11 – INFICON Composer Gas Concentration Controller User Manual
Page 89
3 - 27
IP
N 07
4-
28
9L
Composer Operating Manual
21
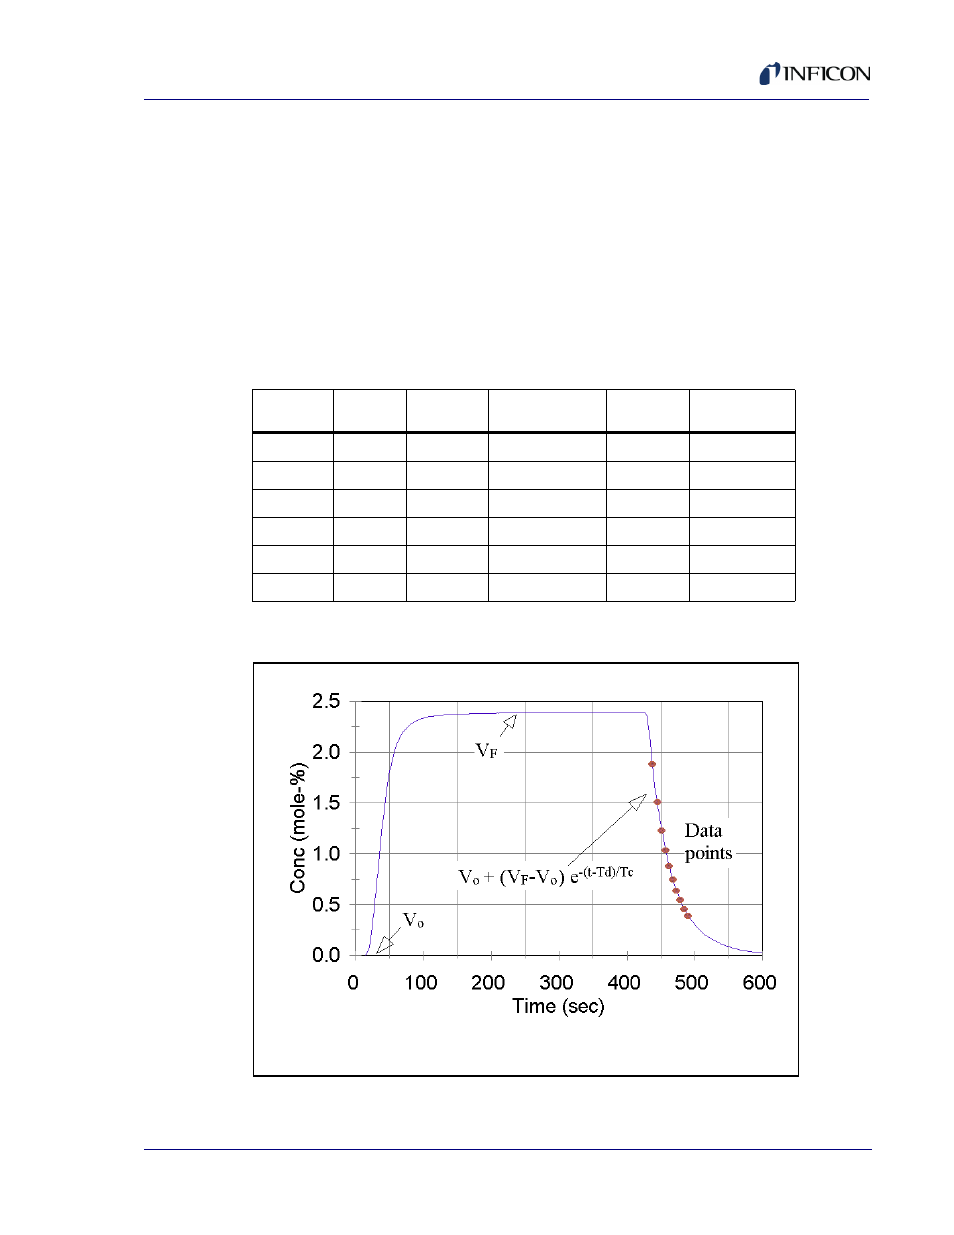
Use linear regression technique to fit data to Y(t) = A + Bt. Then, by
comparing with the above equation, we get Tc = 1/B and Td = -A/B. Thus,
Kp, Tc and Td completely characterize the process under consideration.
The same technique can be used to extract these parameters at an expected
set point, slightly above and slightly below the set point. The average of these
parameters will then be more representative of the dynamics of the process. It
is noteworthy that, in a solid source bubbler like TMIn, the process gain will
gradually diminish with increased flow. The entire procedure of tuning may take
5-30 minutes, depending upon the process. The following table shows some
representative results (nitrogen in hydrogen gas).
Figure 3-11 Concentration transitions during the tuning process. Data points for process
characterization are taken from the decay portion of the cycle.
Table 3-6 Tuning Representative Results (Nitrogen in Hydrogen Gas)
Total Flow
(sccm)
Pressure
(Torr)
Flow
conserved
Process Gain
Kp (mole-%/volt)
Dead Time
Td (sec)
Time Constant
Tc (sec)
400
120
Yes
0.49
2.2
11.3
300
150
Yes
0.65
4.2
14.8
100
200
No
0.95
8.1
22.8
200
300
Yes
0.96
9.8
34.8
200
600
Yes
0.95
17.1
68.8
100
600
Yes
1.89
38.4
113.5