INFICON Composer Gas Concentration Controller User Manual
Page 49
2 - 7
IP
N 07
4-
28
9L
Composer Operating Manual
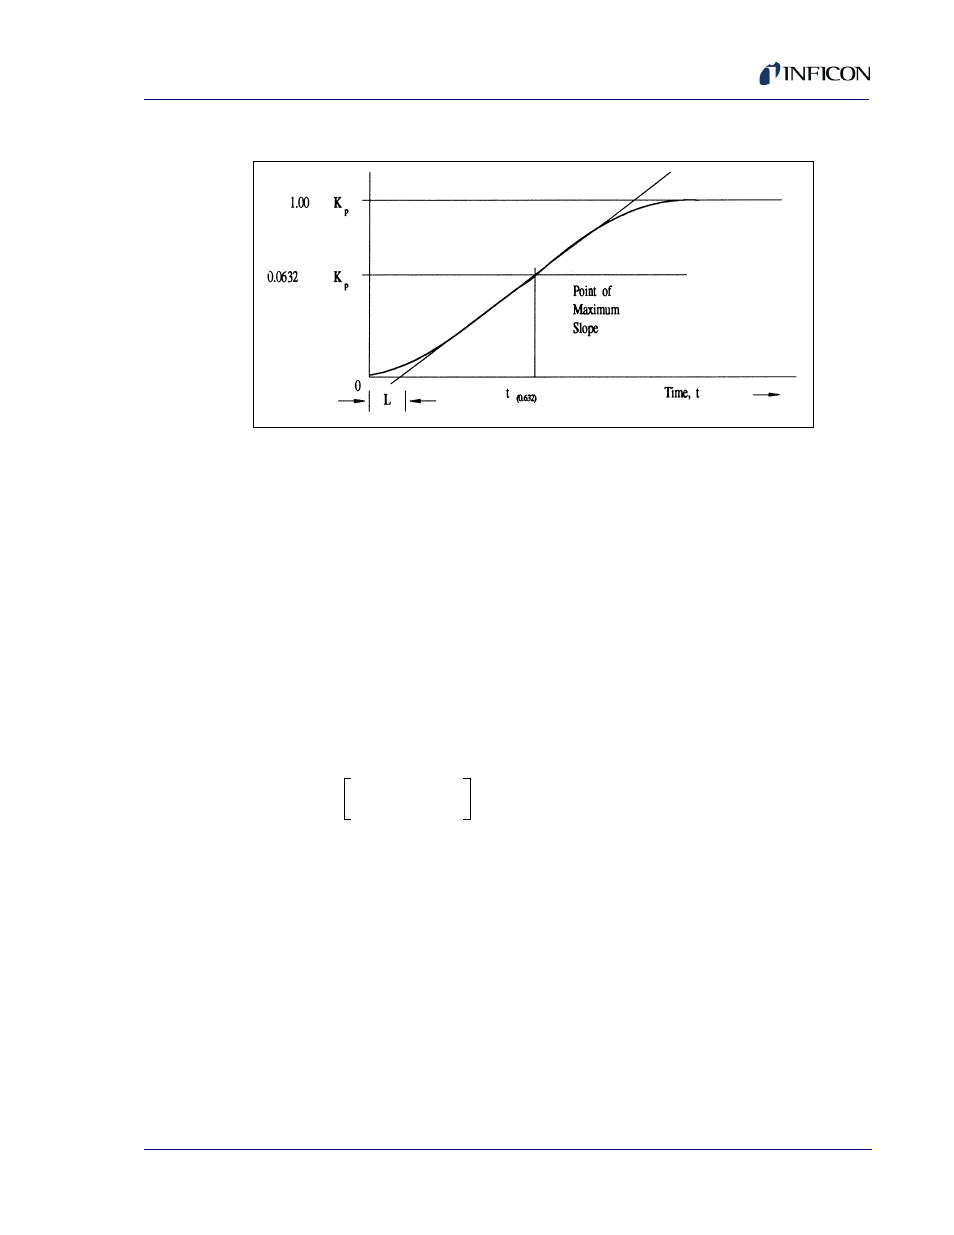
Figure 2-2 Response of process to an open loop step change at t=0
(control signal is increased)
[23]
[24]
The value of three parameters are determined from the process reaction curve.
They are the Steady State Process Gain,
K
p
, the Dead Time,
L
, and the Time
Constant,
T1
. Several methods have been proposed to extract the required
parameters from the system response as graphed in
. These are a
one point fit at 63.2% of the transition (one time constant), a two point
exponential fit, or a weighted least square exponential fit. From the above
information a process is sufficiently characterized so that a controller algorithm
may be optimized.
The PID controller model is shown in Laplace form in
.
[25]
Where
= Manipulated variable or flow
= controller gain (the proportional term)
= integral time
= derivative time
= process error
represents the controller algorithm and a process with first order Lag
and Dead time. The process block implicitly includes the dynamics of the
measuring devices and the final control elements, in our case the mass flow
T1
t
0.632
(
)
L
–
=
K
p
Change in Output
Change in Control Signal
-------------------------------------------------------------
=
M
s
K
c
1
s
T
i
----- T
d
s
+
+
E s
( )
=
M
s
K
c
T
i
T
d
E s
( )