Mate3 screens, Graph screens – Outback Power Systems FLEXmax 80 Owners Manual User Manual
Page 64
MATE3 Screens
62
900-0009-01-00 Rev
C
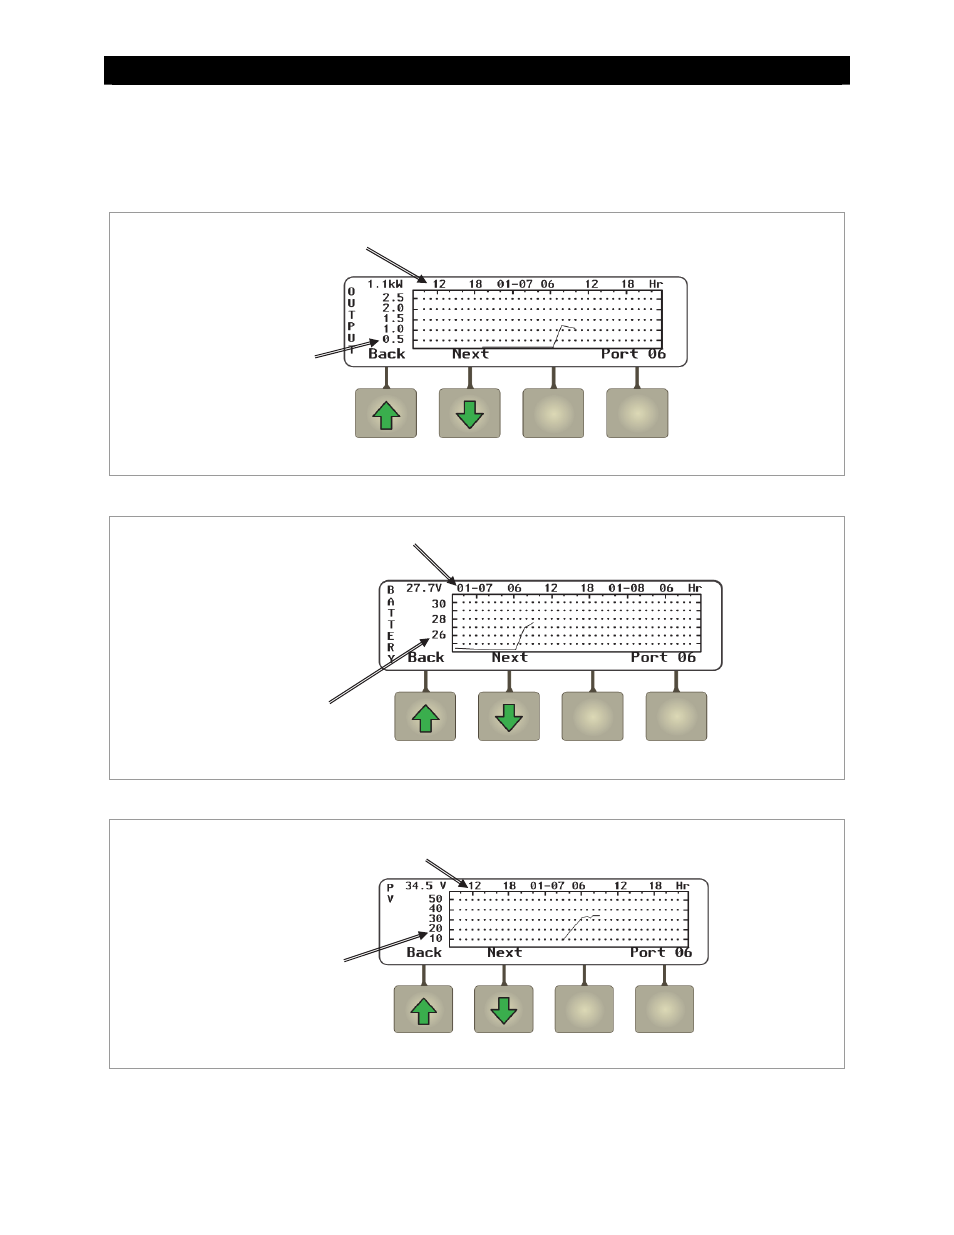
Graph Screens
The
The first screen shows changes in PV wattage over time.
Figure 57
Output Graph
The
Figure 58
Battery Graph
The
Figure 59
PV Graph
Continuing to press the
the beginning.
This axis shows date and time
in 6-hour increments.
This axis shows
PV wattage.
This axis shows
battery voltage.
This axis shows date and time
in 6-hour increments.
This axis shows
PV voltage.
This axis shows date and time
in 6-hour increments.