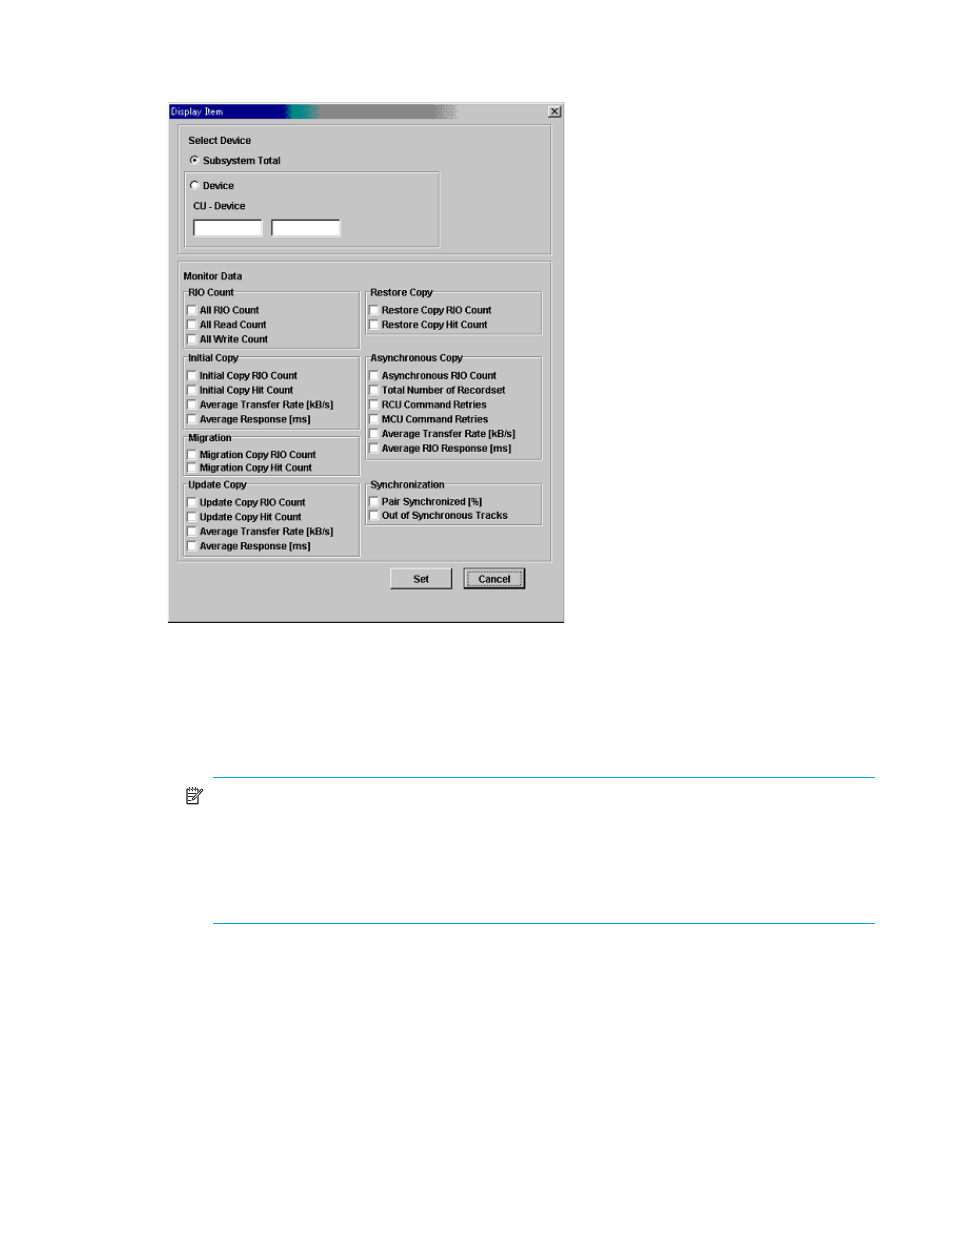
Figure 59 selecting data for usage monitor graph, To close the graph, 59 selecting data for usage monitor graph – HP StorageWorks XP Remote Web Console Software User Manual
Page 111

Hitachi TrueCopy for z/OS user guide 111
2.
In the graph area of the Usage Monitor window, right-click to display the pop-up menu and click
Display Item. The Display Item window is displayed.
Figure 59
Selecting data for Usage Monitor Graph
3.
In the Select Device box of the Display Item window, click one:
• Subsystem Total: The I/O statistics data of all the LDEVs in the disk array is displayed.
• Device: An LDEV of the CU image can be selected. In the CU box, 00-1F can be entered. In the
Device box, 00-FF can be entered. If a device that is not installed is entered, the graph is not
displayed.
NOTE:
• CU_LDEV is displayed on the top of the graph. If # is added to the end of an LDEV number, such
as 3F#, the LDEV is an external volume. For more information about external volumes, see the
HP StorageWorks XP External Storage user guide for the XP12000/XP10000 disk array.
• To display I/O statistics for the sidefile data, select CLPR, and then select the desired CLPR from
the drop-down list.
4.
In the Monitor Data box of the Display Item window, select the I/O statistics data to display on the
graph. More than one check box needs to be selected.
5.
Click Set to close the Display Item window. The Usage Operations window now displays a graph
showing the selected I/O statistics data for the selected LDEV(s).
To enlarge the displayed graph, right-click on the graph and click Large Size. To return the graph to
normal size, right-click on the graph and click Normal Size.
To close the graph:
1.
In the graph display area, right-click on the graph you want to close.
2.
Click Close from the pop-up menu, or click Close All to stop displaying all the graphs. A confirmation
dialog box is displayed.
