Graph – KYORITSU 6310 Instruction Manual User Manual
Page 198
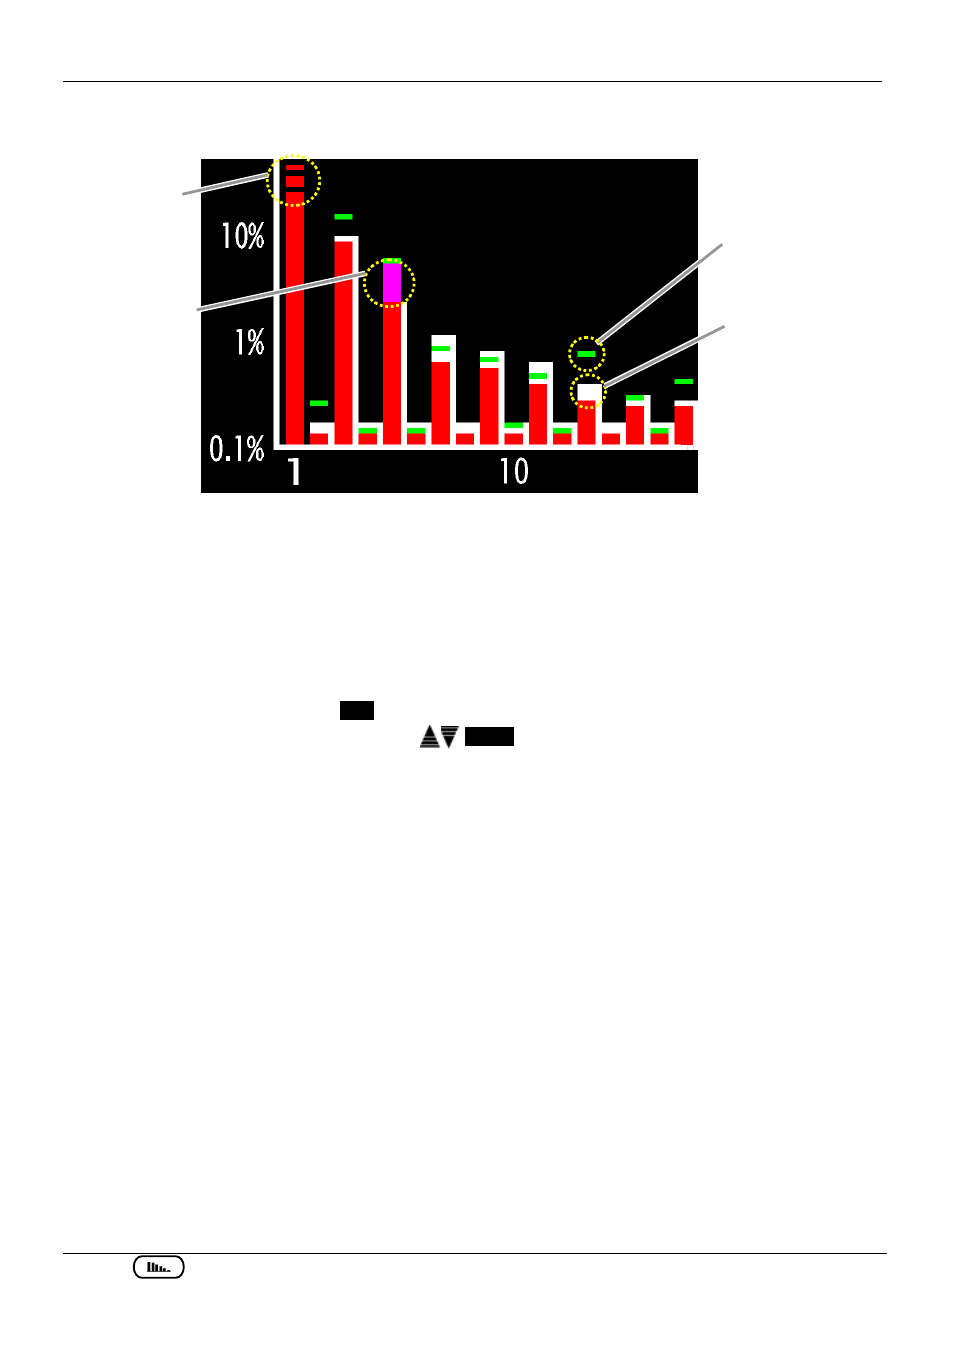
10.1.1 Harmonic Analysis – Display Screen KEW6310
10.3
KEW6310
Graph
Red bar graph
: present value
White bar graph
: preset allowable range (refer to clause 4.2.2 for further details)
Green mark
: max recorded value during a measurement, displayed while MAX HOLD
function is activated. Refer to clause 4.2.2 for further details about MAX
HOLD
function.
* Max value will be reset when;
-
pressing
the
ESC
Key at least 2 sec,
- switching channels with
Cursor
Keys. (except when saving data), or
- starting data saving.
Exceeding
axis value
Allowable range
MAX hold ON:
displayed while
it is activated.
Exceeding the
threshold
See also other documents in the category KYORITSU Tools:
- 1009 (13 pages)
- 1011 (12 pages)
- 1012 (12 pages)
- 1018 (1 page)
- 1030 (1 page)
- 1061 (58 pages)
- 1051 (40 pages)
- 1109S (36 pages)
- 1110 (1 page)
- 2000 (1 page)
- 2002PA (27 pages)
- 2007A (1 page)
- 2009R (33 pages)
- 2012R (2 pages)
- 2017 (1 page)
- 2031 (1 page)
- 2033 (9 pages)
- 2040 (2 pages)
- 2046R (2 pages)
- 2200 (3 pages)
- 2210R (1 page)
- 2300R (1 page)
- 2413F (24 pages)
- 2413R (24 pages)
- 2431 (2 pages)
- 2432 (1 page)
- 2433R (1 page)
- 2434 (10 pages)
- 2500 (1 page)
- 2608A (2 pages)
- 3005A (24 pages)
- 3021 (24 pages)
- 3121A (12 pages)
- 3126 (28 pages)
- 3127 (60 pages)
- 3128 (88 pages)
- 3131A (20 pages)
- 3132A (20 pages)
- 3161A (24 pages)
- 3321A (24 pages)
- 4105A (10 pages)
- 4106 (48 pages)
- 4116A (20 pages)
- 4140 (32 pages)
- 4200 (24 pages)