Shifts in specific period – KYORITSU 6310 Instruction Manual User Manual
Page 174
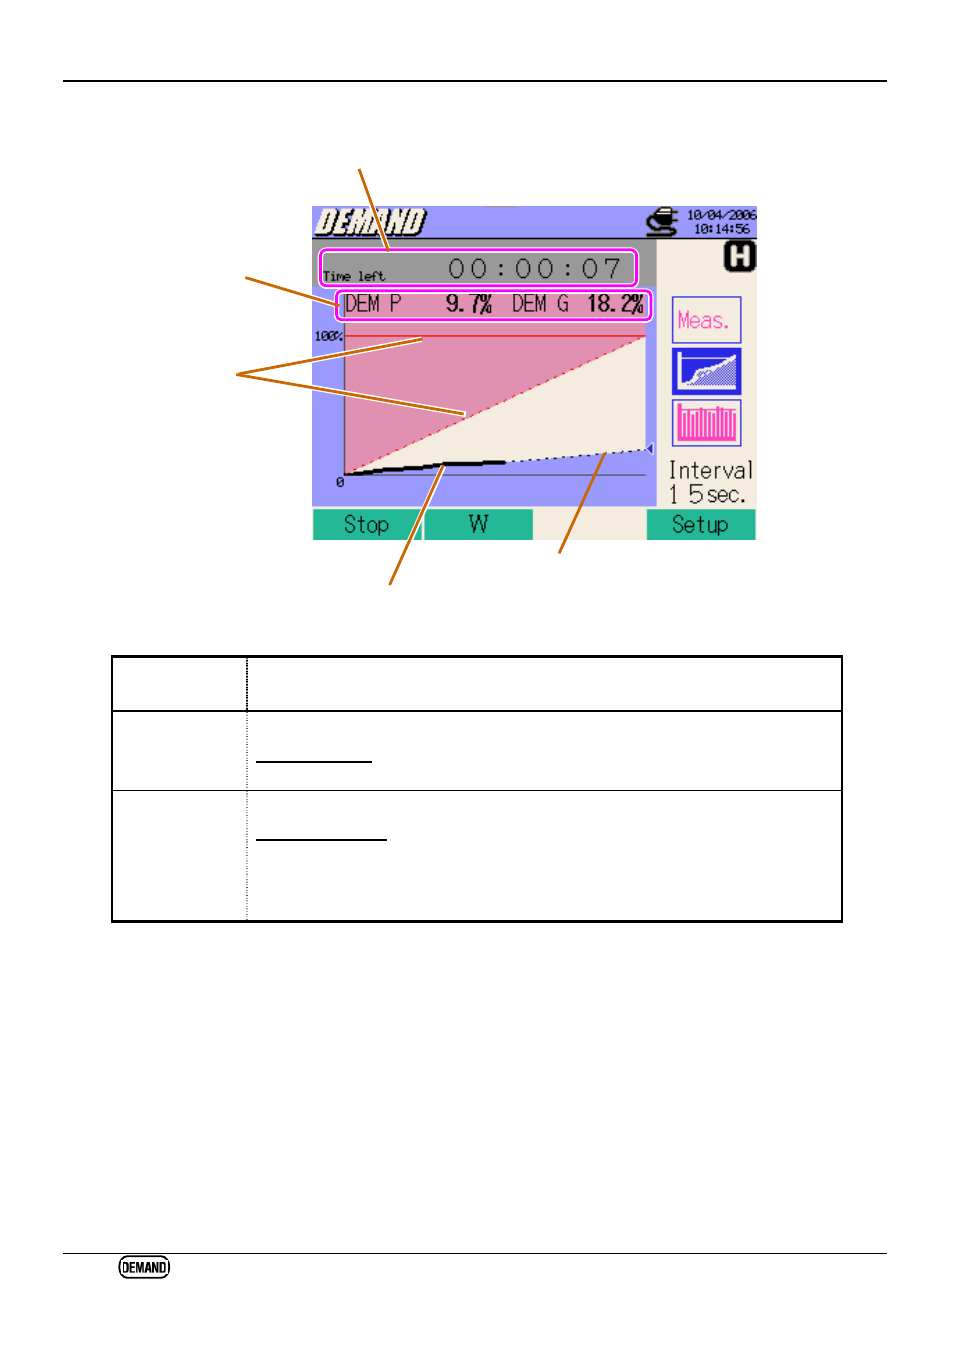
8.1.1 Demand Measurement – Display Screen KEW6310
8.3
KEW6310
Shifts in specific period
Displayed
parameters
Details
Load Factor
Percentage of the present value against the target value.
(Present value)
(Target value)
Prediction
Percentage of the predicted value against the target value.
(Predicted value)
(Target value)
Arrow mark on the graph (
◂
) is blue while the graph is within the target demand,
and becomes red when the target value is exceeded.
Remaining time (Time left)
Target demand
Present value
Load factor / Prediction
Prediction
See also other documents in the category KYORITSU Tools:
- 1009 (13 pages)
- 1011 (12 pages)
- 1012 (12 pages)
- 1018 (1 page)
- 1030 (1 page)
- 1061 (58 pages)
- 1051 (40 pages)
- 1109S (36 pages)
- 1110 (1 page)
- 2000 (1 page)
- 2002PA (27 pages)
- 2007A (1 page)
- 2009R (33 pages)
- 2012R (2 pages)
- 2017 (1 page)
- 2031 (1 page)
- 2033 (9 pages)
- 2040 (2 pages)
- 2046R (2 pages)
- 2200 (3 pages)
- 2210R (1 page)
- 2300R (1 page)
- 2413F (24 pages)
- 2413R (24 pages)
- 2431 (2 pages)
- 2432 (1 page)
- 2433R (1 page)
- 2434 (10 pages)
- 2500 (1 page)
- 2608A (2 pages)
- 3005A (24 pages)
- 3021 (24 pages)
- 3121A (12 pages)
- 3126 (28 pages)
- 3127 (60 pages)
- 3128 (88 pages)
- 3131A (20 pages)
- 3132A (20 pages)
- 3161A (24 pages)
- 3321A (24 pages)
- 4105A (10 pages)
- 4106 (48 pages)
- 4116A (20 pages)
- 4140 (32 pages)
- 4200 (24 pages)