Advanced features – Fluid Components International GF03 User Manual
Page 31
Doc. No. 06EN003352 Rev. B
2 7
Model GF03 Flow Meter
FLUID COMPONENTS INTERNATIONAL LLC http://www.fluidcomponents.com
w
To view the relay switching parameters:
1.
From the Main menu press 5. The 5.0 VERIFY menu title will appear.
2.
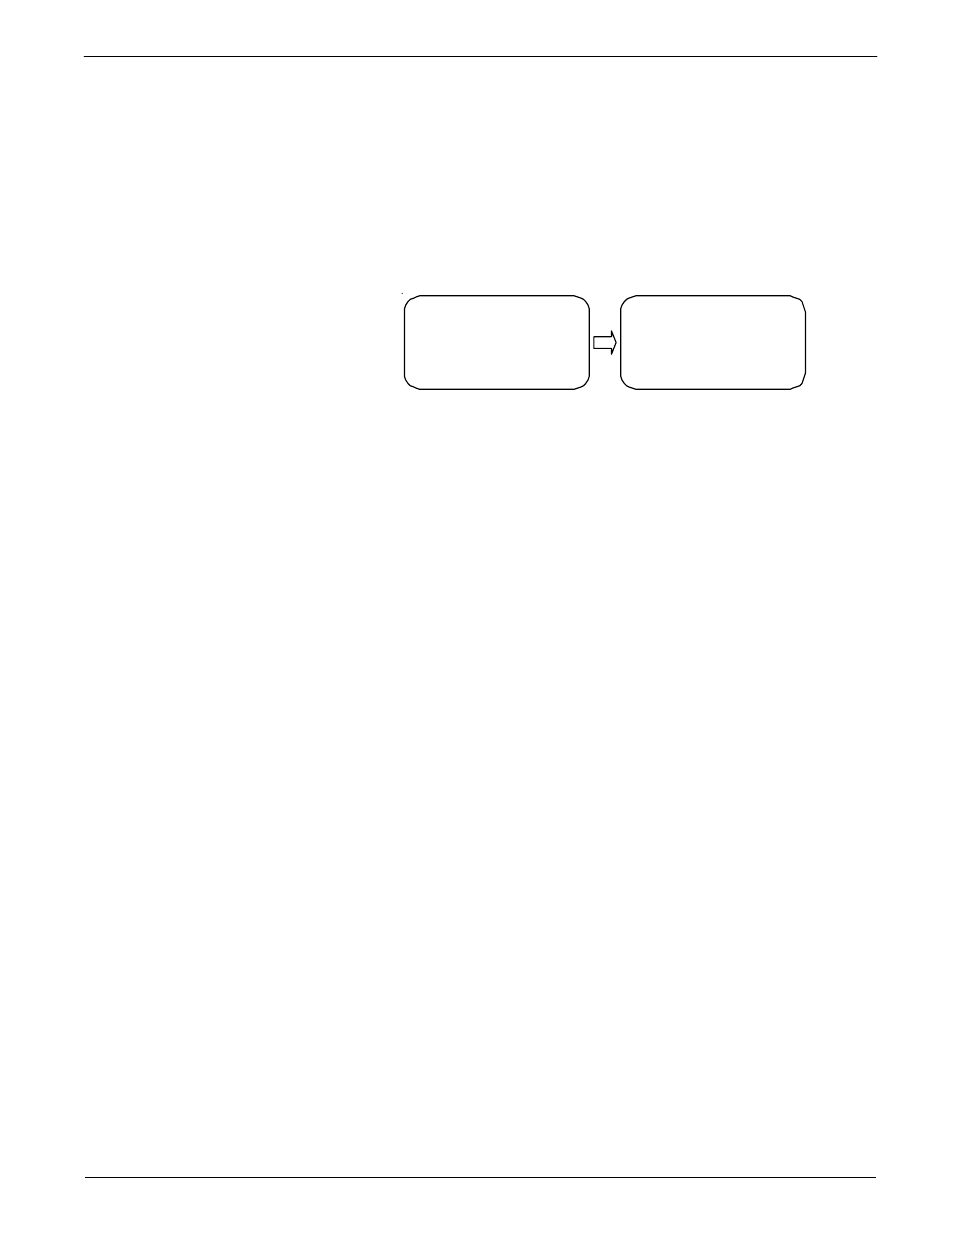
Press 7, the Relay option. The two screens in Figure 19 describe how the two relays
will react to changes in flow rate or temperature. Screen 1, line 1 is the current status
of relay 1. Line 2 shows that the relay will change states when the flow rate exceeds
100 SCFM. The last line displays a hysteresis (H) of 5 SCFM and a delay of about
3 seconds. Screen 2, line 1 is the current status of relay 2. Line 2 and 3 shows that
the relay will switch states on changes in temperature (°F). The state of the relay will
change when the temperature is inside the temperature range of -50 to 150 °F. The
last line displays a hysteresis (H) of 2 °F and a delay of about 1 second.
RELAY 1: OFF
Above 100 SCFM
H: 5.00 D: 3.00
RELAY 2: ON
°F (Inside)
-50 to 150
H: 2.00 D: 1.00
Window 1
Window 2
C00246-1
The remainder of this chapter contains topics that may not be applicable to every user of the
flowmeter. In most cases the flowmeter will be ready for use straight out of the box. However,
there may be an application where the advanced features of the flowmeter may be needed.
This section discusses how to correct for bias errors due to non-ideal installations, how to
communicate with the flowmeter through the serial port, and how to use the multiple
calibration options.
Flow Rate Correction Equation
The flow rate correction equation or corrector is used to bias the flow rate output. The
correction equation contained in the flowmeter allows the user to correct for bias errors due
to non-ideal installation effects. The correction equation is applied to the measured flow rate
and then this corrected flow rate is used to drive the analog outputs and manipulate the relays.
The flow rate shown on the display is also the corrected value. Figure 20 describes how the
correction equation is applied.
The correction equation for the flowmeter is shown below.
m
new
= F
1
+ (F
2
x m
o
)+ (F
3
x m
o
2
)+( F
4
x m
o
3
)
where
m
o
= Measured Flow Rate
F
i
= Correction Equation Coefficients ( i = 1 through 4 )
m
new
= Corrected Flow Rate
Advanced Features
Figure 19 - Relay Staus Verification Display