Target dbg data screen - definitions, Saving meter configuration on a pc, Printing a flow meter configuration report – Dynasonics TFX Ultra Transit Time Flow Meters User Manual
Page 68
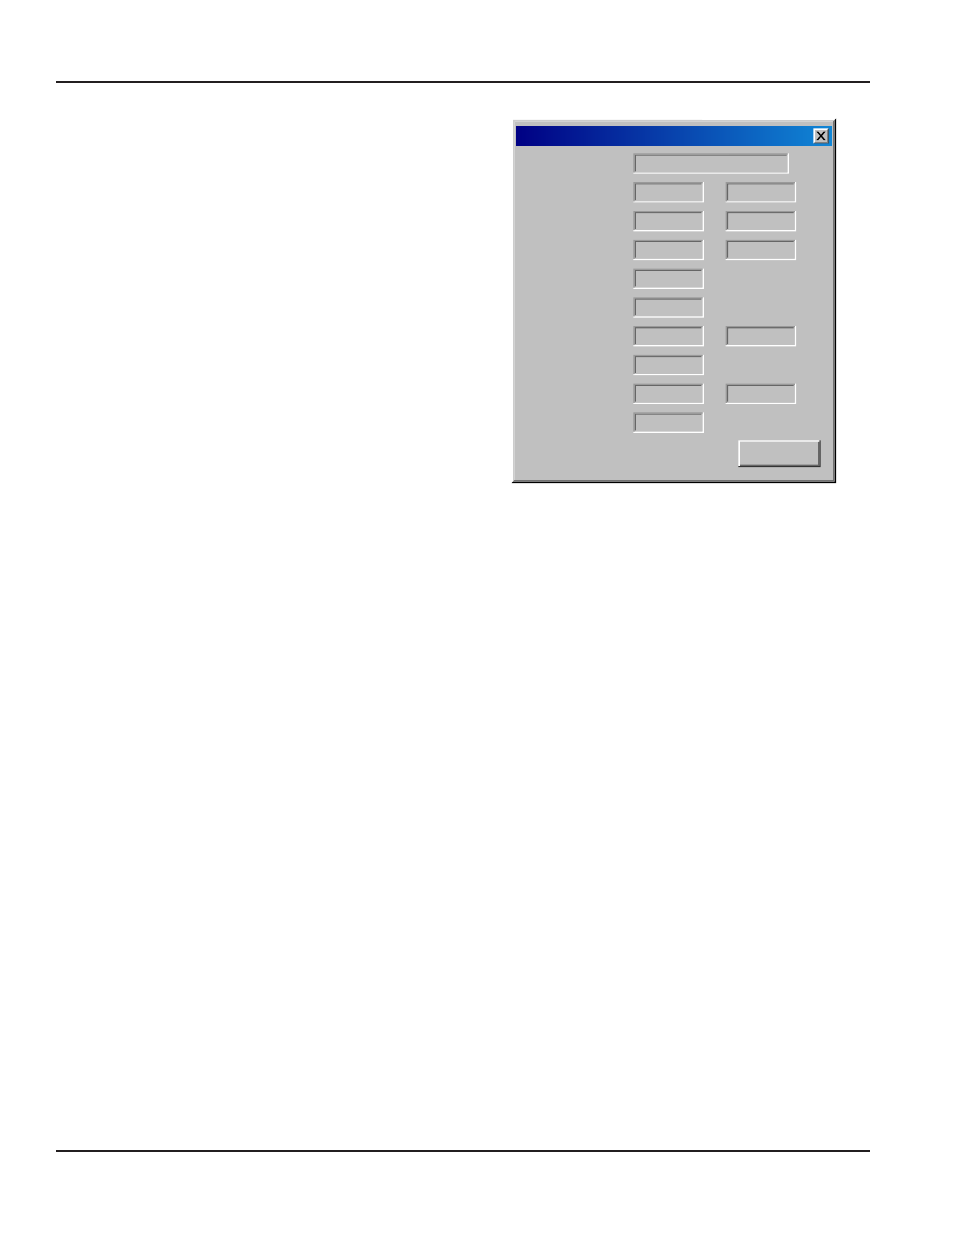
Target Dbg Data Screen - Definitions
1. Calc Count – The number of flow calculations performed
by the meter beginning at the time the power to the
meter was last turned off and then on again.
2. Sample Count – The number of samples currently being
taken in one second.
3. Raw Delta T (ηs) – The actual amount of time it takes for
an ultrasonic pulse to cross the pipe.
4. 4) Course Delta T – This meter series uses two wave
forms. The coarse to find the best delay and other timing
measurements and a fine to do the flow measurement.
5. Gain – The amount of signal amplification applied to the
reflected ultrasound pulse to make it readable by the
digital signal processor.
6. Gain Setting/Waveform Power – The first number is the
gain setting on the digital pot (automatically controlled
by the AGC circuit). Valid numbers are from 1…100.
The second number is the power factor of the current
waveform being used. For example, 8 indicates that a 1/8
power wave form is being used.
7. Tx Delay – The amount of time the transmitting
transducer waits for the receiving transducer to recognize
an ultrasound signal before the transmitter initiates
another measurement cycle.
8. Flow Filter – The current value of the adaptive filter.
9. SS (Min/Max) – The minimum and maximum signal
strength levels encountered by the meter beginning at
the time the power to the meter was last turned off and
then on again.
10. 1Signal Strength State – Indicates if the present signal
strength minimum and maximum are within a pre–
programed signal strength window.
11. Sound Speed – The actual sound speed being measured
by the transducers at that moment.
12. Reynolds – A number indicating how turbulent a fluid is.
Reynolds numbers between 0 and 2000 are considered
laminar flow. Numbers between 2000…4000 are in
transition between laminar and turbulent flows and
numbers greater than 4000 indicate turbulent flow.
13. Reynolds Factor – The value applied to the flow
calculation to correct for variations in Reynolds numbers.
Ta r g e t D b g D a t a
R e s e t
D e v i c e Ty p e :
TFX U l t r a
Tx D e l a y :
4 1 3
7
Fl o w Fi l t e r :
8 0
8
S o u n d S p e e d :
4 9 0 0
11
S e r i a l N o ( TFX D ) :
C a l c C o u n t :
2 . 2 C PS
5 4 2 4 7
1
2
R a w D e l t a T ( n s ) :
0
- 1 0 . 7 3
3
4
G a i n :
6 6 / 8
4 3 0
5
6
S S ( M i n / M a x ) :
OK
8 . 0 / 9 2 . 4
9
10
R e y n o l d s :
0 . 7 5 0 0
2 0 . 1 5
12
13
Figure 53: Target Dbg data screen
Saving Meter Configuration on a PC
The complete configuration of the flow meter can be saved
from the Configuration screen. Select File Save button
located in the lower left-hand corner of the screen and
name the file. Files are saved as a *.dcf extension. This file
may be transferred to other flow meters or may be recalled
should the same pipe be surveyed again or multiple meters
programmed with the same information.
Printing a Flow Meter Configuration Report
Select File from the upper task bar and Print to print
a calibration/configuration information sheet for
the installation.
SETTING ZERO AND CALIBRATION
Page 68
March 2014