View trends – RLE FMS V.1.13 User Manual
Page 112
112
FMS User Guide
800.518.1519
3
Web Interface Configuration
before it begins to overwrite. At an 8 hour interval, the FMS will store approximately 3.5
years of data before it begins to overwrite the oldest data.
Figure 3.48
Establish Trending
5
Click the Format Trend button to save your information. Once the information has been
saved, you’ll notice the Info field for that trend will populate itself.
NOTE Because of the way the FMS saves its data, you need to fully configure one trend and click the
Format Trend button on its line before you configure the next trend. If you attempt to
configure multiple trends at once, only the data associated with the Format Trend button you
click will be saved.
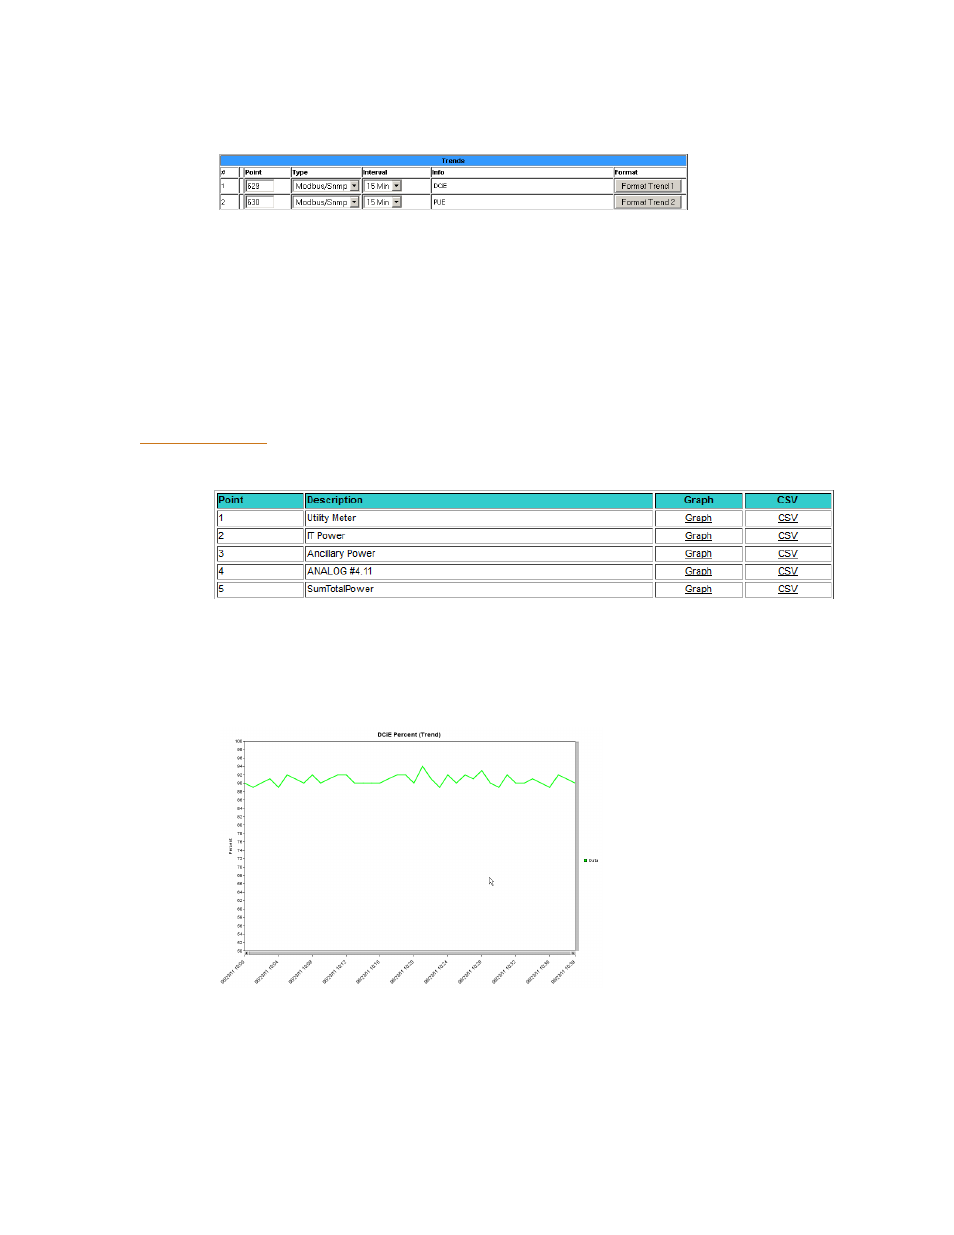
View Trends
1
On the FMS interface, go to History>Extended Trends.
Figure 3.49
View your Trending Data
2
Locate the point number you configured. Click the Graph link to access a Java-based graph
of the data. The X and Y axis of the graph are adjustable. Click and drag the bars on the
axes to a more or less detailed view of your data.
Figure 3.50
Trending Graph