Fig. 6.9.2. – status panel – Dataman 520 Series User Manual
Page 72
DATAMAN oscilloscope
User’s Guide
The threshold amplitude is represented by a grey horizontal line in the amplitude part.
You can change the threshold by dragging this line. Phase is displayed only for the
harmonics with amplitude above this threshold.
If the decibels amplitude mode is activated, you can change the amplitude range by
dragging ticks in the left of the amplitude part.
The captured harmonic can be selected by the vertical grey cursor.
You can scroll data using the scroll bar located below the main screen.
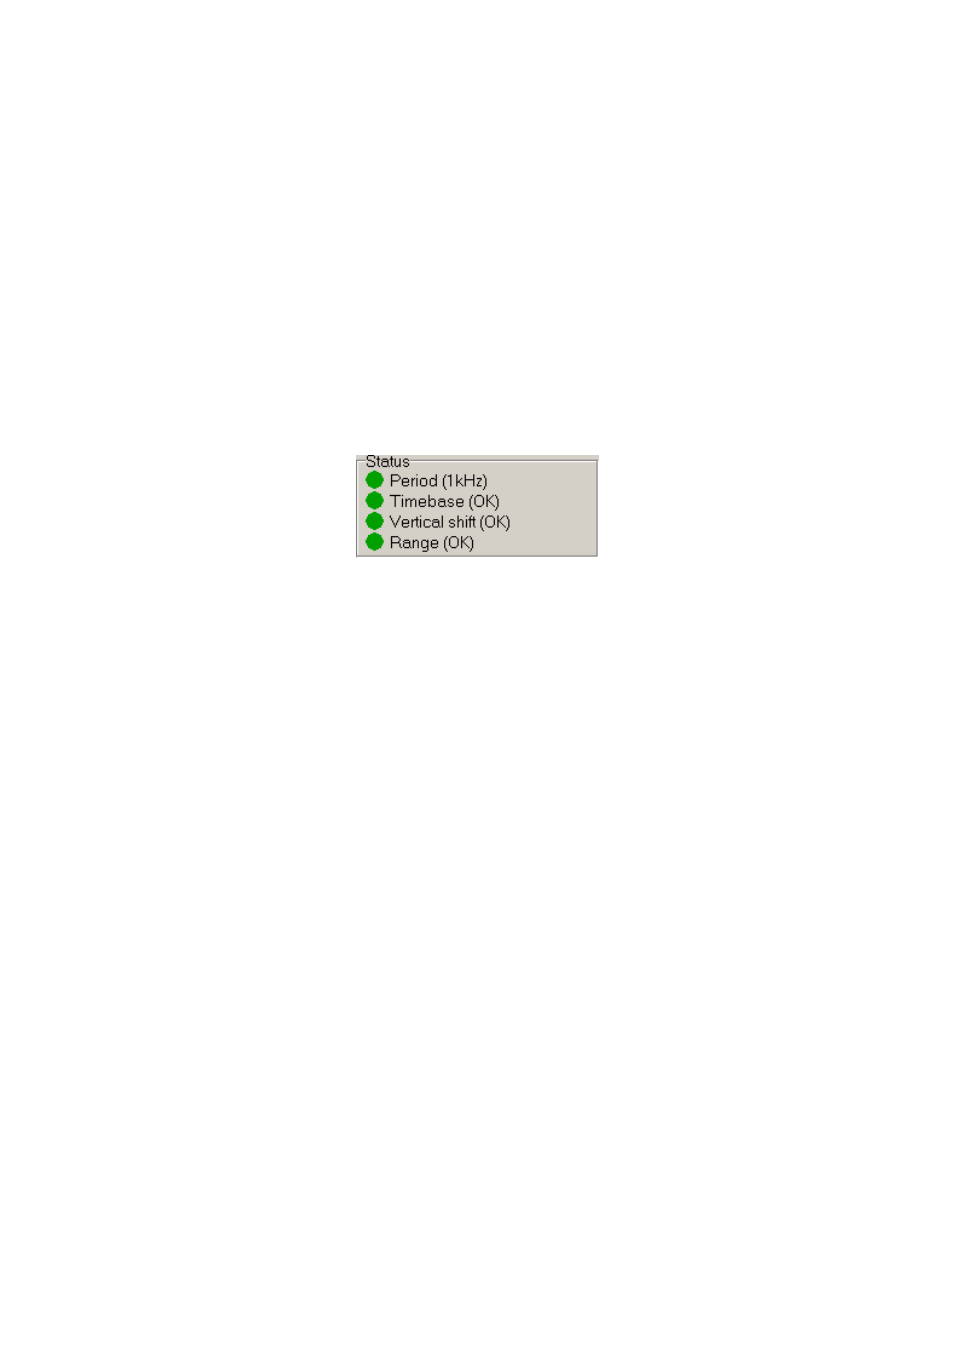
The status panel with information about the analyzed signal is located in the left
bottom corner of the main window.
Fig. 6.9.2. – Status panel
If the indicator „Period“ is:
red – the application was not able to find the period automatically
green – period found successfully
grey – the manual selection of the period is activated
The
current
selected
period
is displayed in parentheses.
If the indicator „Timebase“ is:
red, yellow – the timebase is too slow for the analyzed signal, a faster
timebase will produce better results
green – suitable timebase is set
grey – the automatic period selection is deactivated
If the indicator „Vertical shift“ is:
red – the vertical shift is not suitable. If the „Up“ is in parentheses, the
waveform is shifted up, „Down“ – waveform is shifted down.
green – suitable vertical shift is set.
If the indicator „Range“ is:
red – the range is not suitable. If the „Sensitive“ is in parentheses, the
sensitive range is set, „Insensitive“ – the insensitive range is set.
green – suitable range is set.
The information about the harmonic selected by the cursor are displayed in the bottom
of the main window.
- 72 -