Special functions controls, Fading controls, Special functions controls 4.1.15. fading controls – Dataman 520 Series User Manual
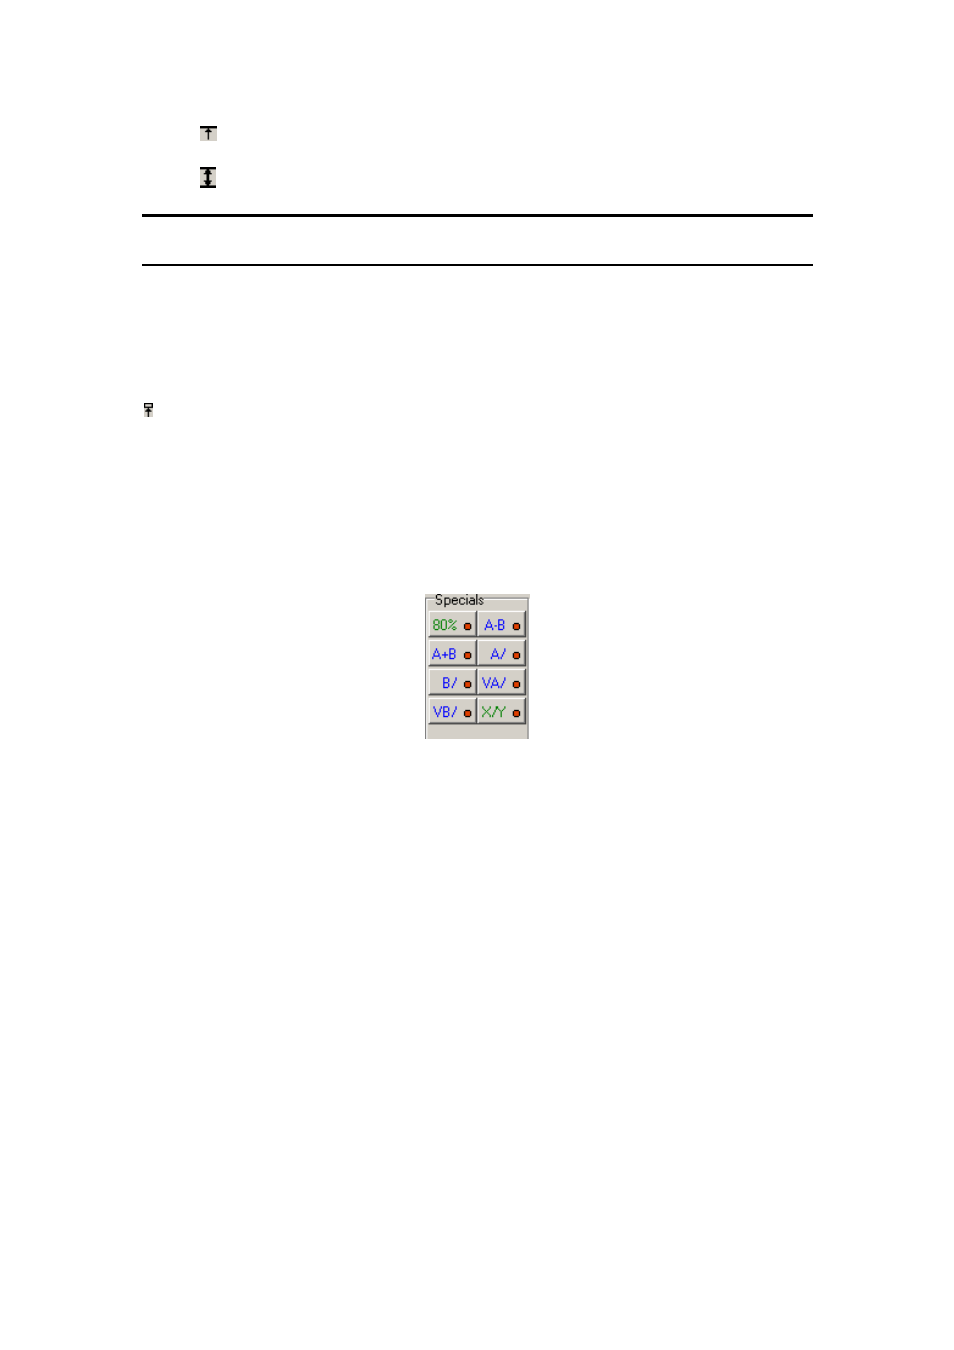
Page 43: Fig. 4.1.14.1. – special functions controls

DATAMAN oscilloscope
User’s Guide
- voltage between horizontal cursor 1 and 0V (this information is not
displayed when coupling is set to AC)
- voltage between horizontal cursor 1 and 2
WARNING: If the improper probe attenuation is set, the information will be
inaccurate.
„U(t)“ – minimum and maximum (in case more than one sample is displayed on one
point of the screen) voltage between 0V and the intersection of vertical cursor 1 and
waveform
- trigger threshold voltage
“A” – ratio of the peak-peak voltage of the waveform on the screen and the voltage
between horizontal cursors in decibels
4.1.14. Special functions controls
The special functions controls are located in the lower left corner of the main window.
Fig. 4.1.14.1. – Special functions controls
Two function types exist:
1. Transformation functions which display result on the main screen using the virtual
channel. These have a blue color.
2. Other functions which dont display results on the main screen. These have a green
color.
Click one of the transformation function buttons to half-activate it. After clicking on
the desired virtual channel the function is fully activated and the results are displayed
with the color of the selected virtual channel.
Click one of the other function buttons to activate it.
You can find the special functions description in chapter 6.
4.1.15. Fading controls
It is possible to display data on the screen with persistance (fading mode). When in
this mode the old waveform isn’t removed from the screen when a new one is being
- 43 -
