Inserting a chart/changing the chart type – Turning Technologies TurningPoint 5 User Manual
Page 77
TurningPoint 5 for Mac
77
TIP
Correct answer indicators can be formatted like regular PowerPoint objects. Control-click on the
object and select a formatting option from the menu.
Inserting a Chart/Changing the Chart Type
A chart displays the results of participant responses. The display options, such as colors, labels and value, can be defined in
the Preferences. For more information on how to set default chart options, see
Prerequisites
To make a PowerPoint slide interactive, a TurningPoint chart must be added to the slide. Assuming that the PowerPoint slide
is in Title and Content form, a chart can be added by following the steps below.
1
Select the polling slide.
TIP
Select more than one slide by holding down the Cmd or Shift key on the keyboard.
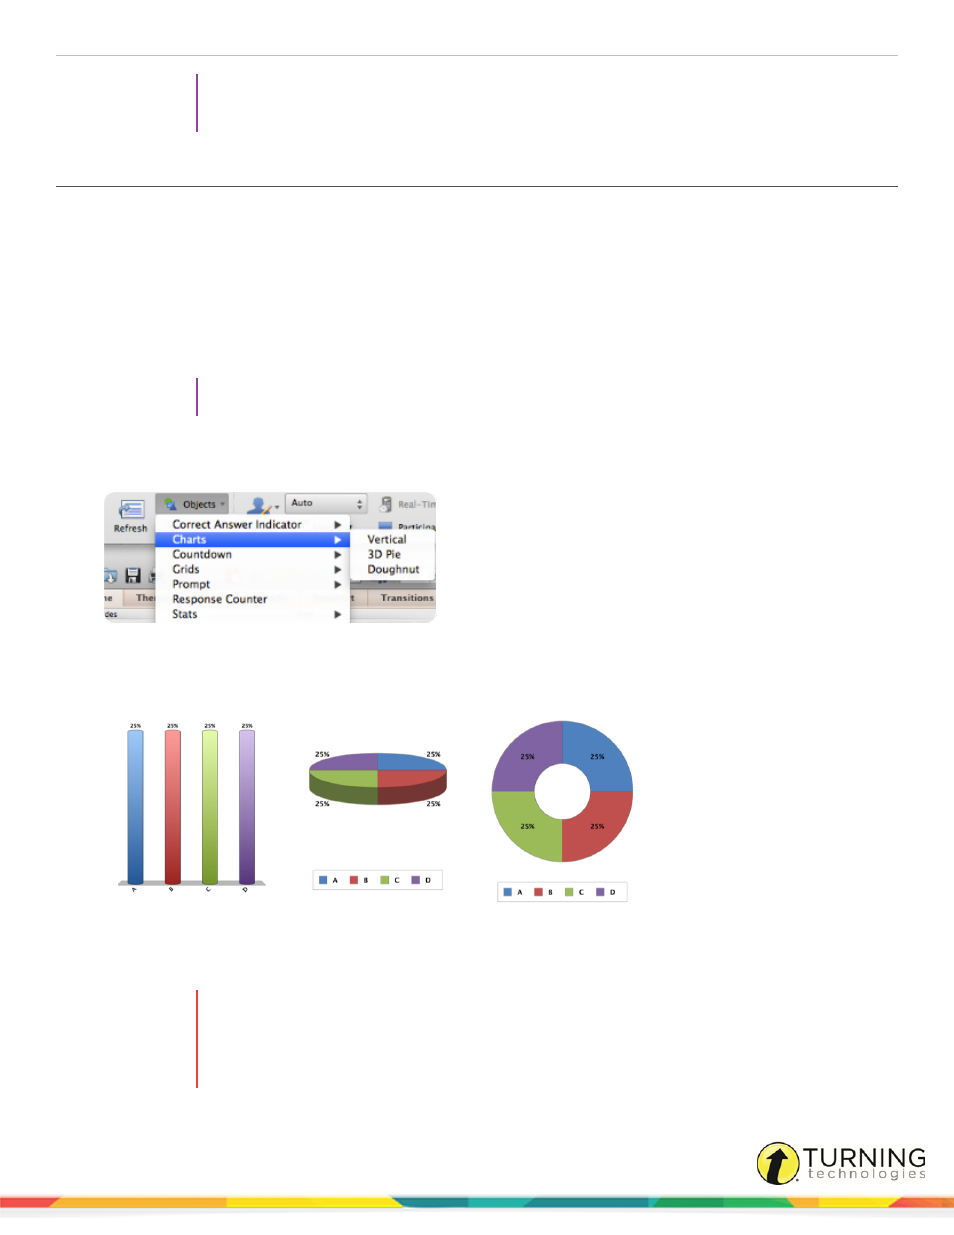
2
From the TurningPoint toolbar click the Objects icon, mouse over Charts and select the desired chart.
Office 2011
There are three chart types available.
Vertical
3D Pie
Doughnut
3
Select a different chart from the Objects menu to change the current chart on the slide.
4
To remove the chart, simply delete the object from the slide.
WARNING
Deleting a TurningPoint chart from a slide demotes the slide to non-interactive. To hide the chart
from the audience, simply uncheck the Show Results option in the Slide Preferences Panel or to
apply to all slides, click the Preferences icon on the TurningPoint toolbar, select PowerPoint,
uncheck Show Results and click Apply All.
turningtechnologies.com/user-guides