Charts – Turning Technologies TurningPoint 5 User Manual
Page 58
TurningPoint 5 for Mac
58
NOTE
The Apply All button will apply the setting to question slides in the current presentation and all future
slides.
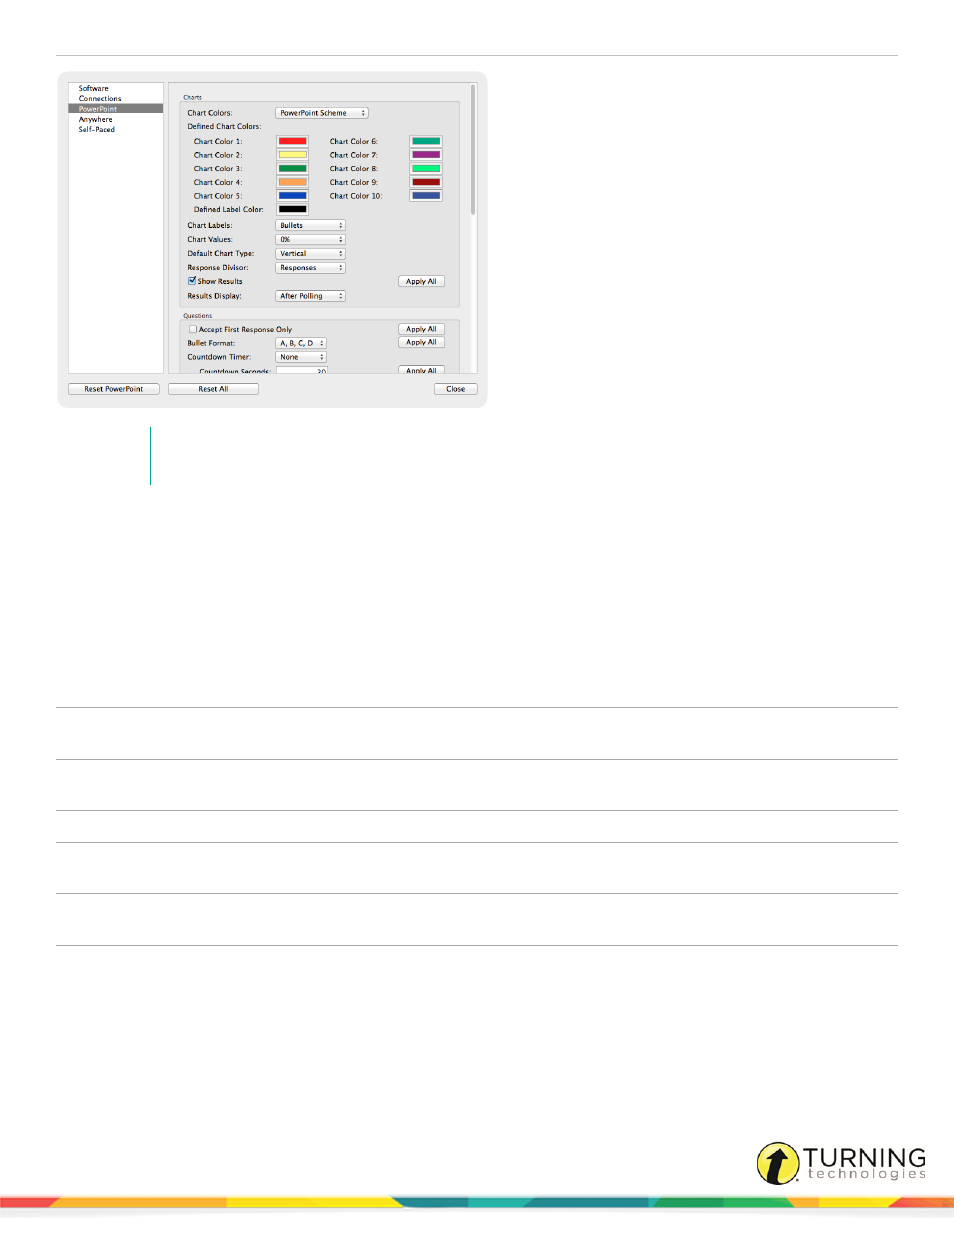
Charts
This section enables the user to view and change the chart preferences.
Chart Colors
Select a color scheme from the drop-down menu to determine what colors will be used during the
presentation. There are two options available.
l
PowerPoint Scheme - Uses the selected PowerPoint color scheme.
l
Defined - Uses user defined chart colors.
Defined Chart Colors
These are the colors that will display when Defined is the selected Chart Color. Click a color to
open the color palette and select a new color.
Defined Label Color
Determines the color of the chart label text. Click the color to open the color palette and select a
new color.
Chart Labels
Determines if answer text or bullets will be displayed in the chart labels and legends.
Chart Values
Determines whether a response count (number of participants) or a percentage is displayed.
There are three formats for displaying the percentage: 0%, 0.0% and 0.00%.
Default Chart Type
Determines the default chart that is used when a slide is inserted into a presentation. To change
the chart type, simply select another one from the drop-down menu.
Response Divisor
Determines whether the divisor used to calculate the percentages on a multiple response
question will be:
l
the total number of responses received (responses)
l
the total number of participants in the session’s participant list
l
the total number of devices that responded
turningtechnologies.com/user-guides