Comparative results – Turning Technologies TurningPoint 5 User Manual
Page 137
TurningPoint 5 for Mac
137
l
Question text
l
Question type
l
Answer choices
l
Responses (percentage and
count)
l
Chart
Checking the boxes in the right panel
adjusts the details of the report.
l
Question Statistics - Adds a
table to the report under each
question that displays the Mean,
Median, Variance and Standard
Deviation for each question.
l
Screenshots - Displays the
screenshot with each question.
NOTE
Include Screenshots must be checked in the Anywhere preferences.
l
Overall Standards - Displays the percentage of overall comprehension for each standard.
l
Demographics - Check a box next to the demographic(s) to be displayed.
NOTE
Any demographic assigned from a slide or a participant list will be displayed. If a slide was
selected to “save to participant list” and is present in the session, it will be displayed twice.
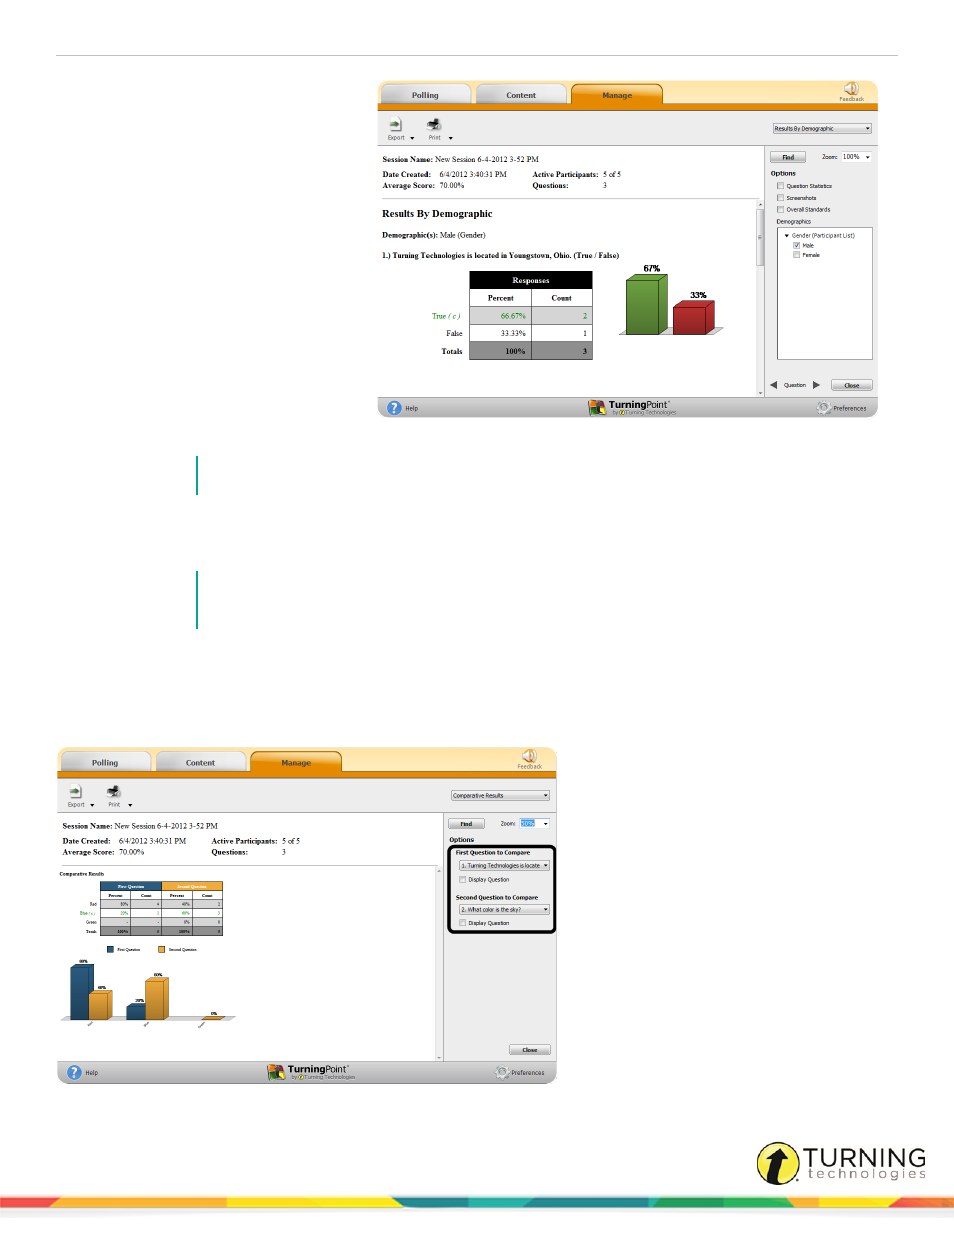
Comparative Results
The Comparative Results report allows a user to select two questions from the session and compare them side-by-side.
Select the questions to be compared from the drop-down menus on the right panel.
turningtechnologies.com/user-guides