Checkline FH Series User Manual
Page 37
© ElektroPhysik MiniTest 7200 FH / MiniTest 7400 FH
37
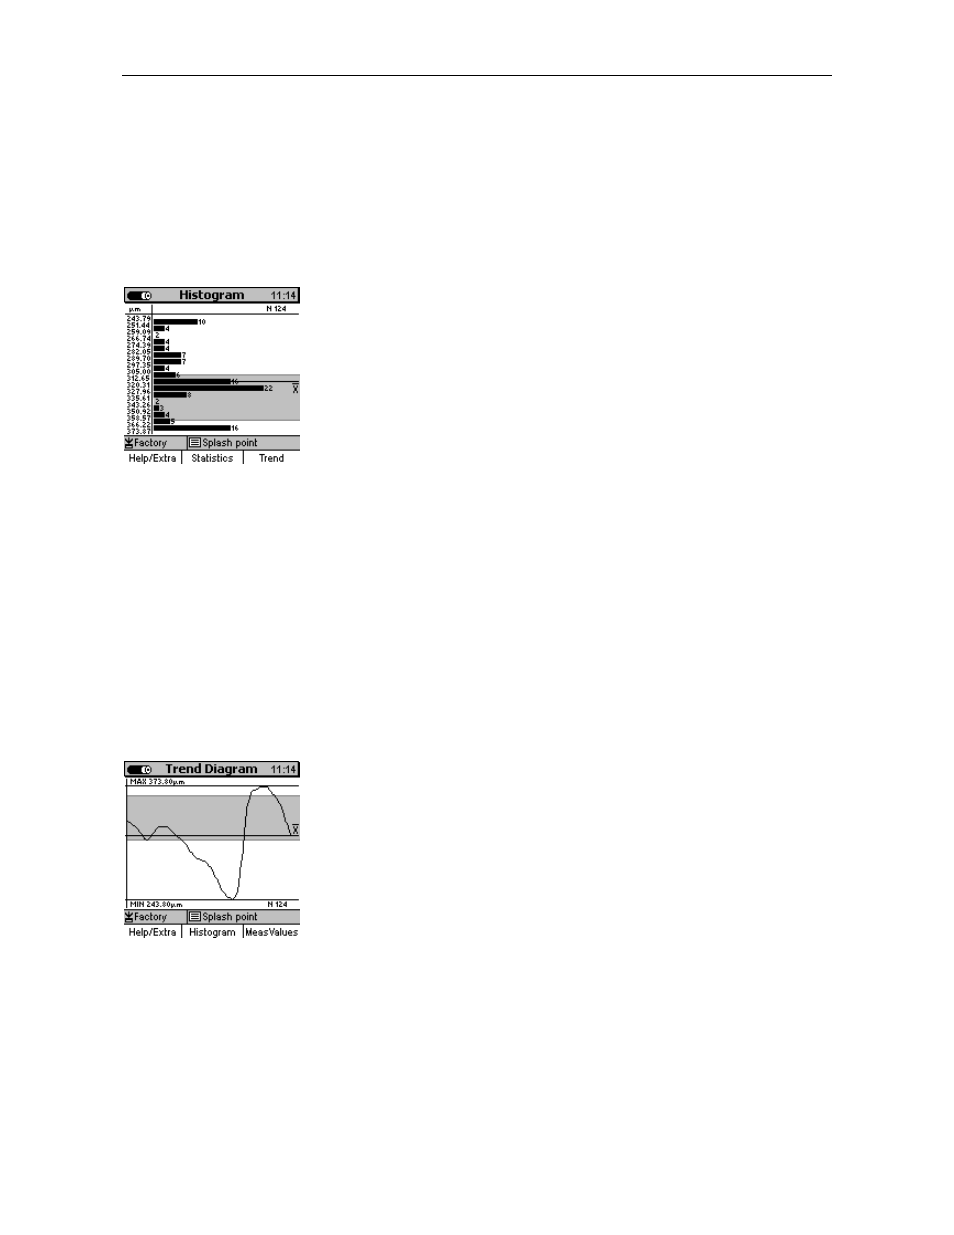
8.4 Histogram on MiniTest 7400 FH
From Main Menu chose “Statistics“. Use arrow keys to move to “Histogram“. Press OK to confirm.
From Measure Menu press function key “Statistics” followed by function key “Histogram”.
A histogram is a kind of plot that summarizes how data are
distributed. It gives you information on how the production process
might be changed in order to be optimized.
The limit range is the gray-highlighted area. See also 8.1.1 “Upper
and lower spec. limits”.
Please note: For a histogram, a minimum number of 5 readings are
required.
8.5 Trend Diagram on MiniTest 7400 FH
From Main Menu chose “Statistics“. Use arrow keys to move to “Trend Diagram“. Press OK to
confirm.
From Measure Menu press function key “Statistics” followed by function key “Histogram”. Then
press function key “Trend”.
A trend illustrates the tendency of readings so that deviations can be
quickly identified.
The limit range is the gray-highlighted-area.
For a trend-diagram, at least 5 readings are required.