Brookfield DV-III Ultra Rheometer User Manual
Page 74
Brookfield Engineering Laboratories, Inc.
Page 74
Manual No. M/98-211-B0104
Brookfield Engineering Laboratories, Inc.
Page 74
Manual No. M98-211-E0912
IV.8.4
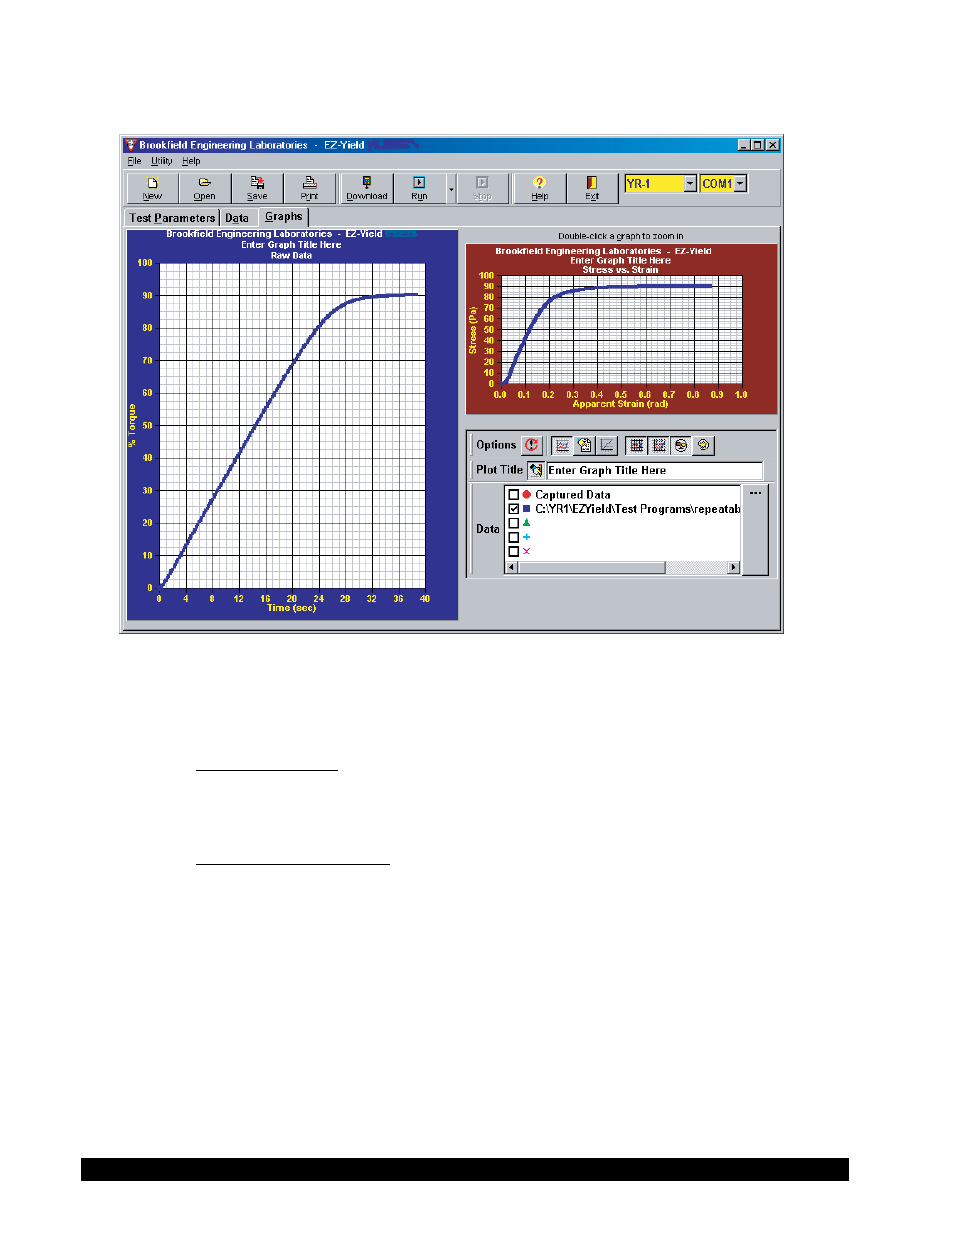
Graphs Page
Figure IV-61
Use this page to graphically display yield test data both on-line (i.e. while the test is running) and
after it is collected.
Two (2) graphs are displayed on this page.
1. % Torque vs. Time
This graph displays the % Torque values versus the time (since the beginning of the
Run cycle) at which the data points were collected. Torque is displayed in units of %
of full scale range while the Time is displayed in seconds.
2. Stress vs. Apparent Strain
This graph displays the calculated Stress values versus the calculated Apparent Strain
values for each data point collected. Stress is displayed in units of Pascals (Pa) while
Apparent strain is displayed in units of radians (rad).
See Appendix D2 - Spindle Codes and Speeds for Yield Tests - for more information regarding these
calculated values.
Double-clicking on either graph enlarges or zooms that graph and displays it on the left side while
shrinking the other graph and displaying it on the right.
The three (3) toolbars on the right side of the page can be resized and moved within the confines of
the toolbar box by clicking and dragging the toolbar sizer located to the left of the toolbar title.