Brookfield DV-III Ultra Rheometer User Manual
Page 72
Brookfield Engineering Laboratories, Inc.
Page 72
Manual No. M/98-211-B0104
Brookfield Engineering Laboratories, Inc.
Page 72
Manual No. M98-211-E0912
IV.8.3
Data Page
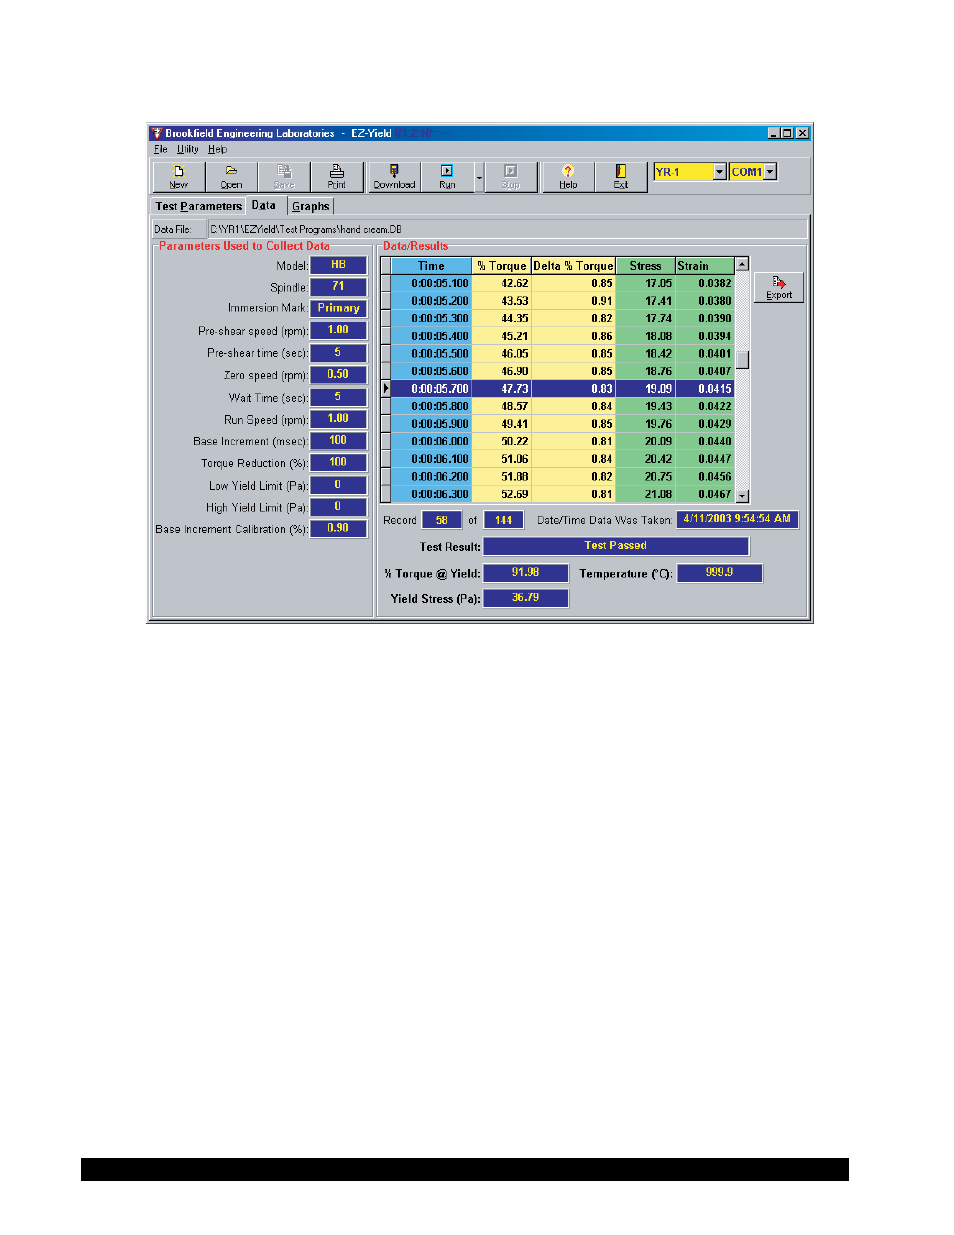
Figure IV-60
Use this page to load, save, print, and export data taken with the DV-III Ultra Rheometer. The file
name (including path) of the data currently loaded is displayed at the top of the page.
The test parameters used to collect the data are displayed on the left of the page in the box labeled
“Parameters Used To Collect Data”.
Data is displayed on the right of the page in the box labeled “Data/Results”. All recorded data
points are displayed in the table.
Time
Elapsed time since the beginning of the run cycle is shown here in units of
hours, minutes, seconds, and thousandths of seconds (
H:MM:SS.SSS).
Data is taken at an interval equal to the Base Increment parameter.
% Torque
This field displays actual measured % Torque value
Delta % Torque
This field displays the difference between the current % Torque value and
the previous % Torque value. As the sample approaches its yield point,
the Delta % Torque should begin to decrease. If the Torque reduction for
the test is 100%, the yield point occurs when the % decrease in torque =
100.
Stress
This field displays the calculated stress for each data point. The final Stress
value (i.e. the Stress at the yield point) is the resultant yield stress. See
Appendix D - Calculations - for the equation used to calculate stress.