Brookfield DV-III Ultra Rheometer User Manual
Page 60
Brookfield Engineering Laboratories, Inc.
Page 60
Manual No. M/98-211-B0104
Brookfield Engineering Laboratories, Inc.
Page 60
Manual No. M98-211-E0912
IV.7.3 The Bingham Model
€
t =
€
t
o
+ h
D (
€
t
= shear stress,
€
t
o
= yield stress, η = plastic viscosity, and D = shear rate)
What does it tell you?
The Bingham model indicates a product’s yield stress,
€
t
o
, which is the amount of shear stress
required to initiate flow. It also provides the plastic viscosity,
η
, which is the viscosity after a
product yields.
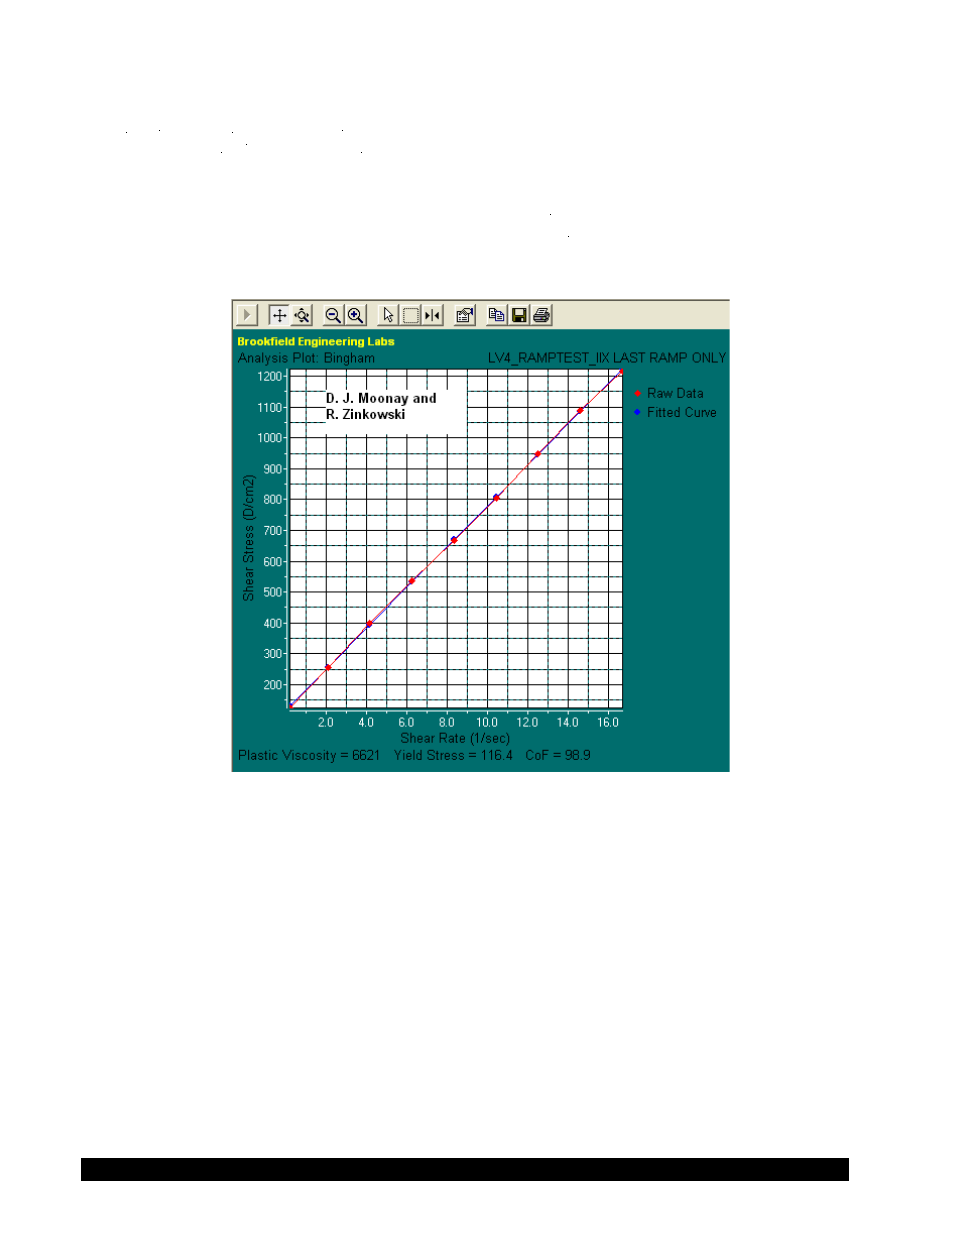
Figure IV-50
When should you use it?
This model should be used with non-Newtonian materials that have a yield stress and then behave
in a Newtonian fashion once they begin to flow. As a result, the shear stress-shear rate plot forms
a straight line after yielding. (Products that have a yield stress only begin to flow after a certain
amount of shear stress is applied. They are also called “viscoplastic”. Their shear stress vs. shear
rate graphs intersect the y-axis at a point greater than 0.)