Apple AppleWorks 5 : Windows 95/NT 4.0 User Manual
Page 163
Spreadsheet
7-29
Making charts
To make a chart, select a cell range and then choose Make Chart from the
Options menu. In the Chart Options dialog box, click a chart type in the
Gallery, and then click OK. AppleWorks draws the chart and places it on top
of the spreadsheet.
Tip
To create a chart quickly, select the cells and click one of the chart buttons
on the Default button bar. Double-click the chart to change chart options.
You can create more than one chart for each spreadsheet or spreadsheet frame.
Updating chart data
The chart is linked to the spreadsheet, so when you
change data in the spreadsheet, AppleWorks updates the chart. Copying (or
cutting) and pasting a chart severs its link to the spreadsheet data. If you then
change the spreadsheet data, AppleWorks won’t update the pasted chart.
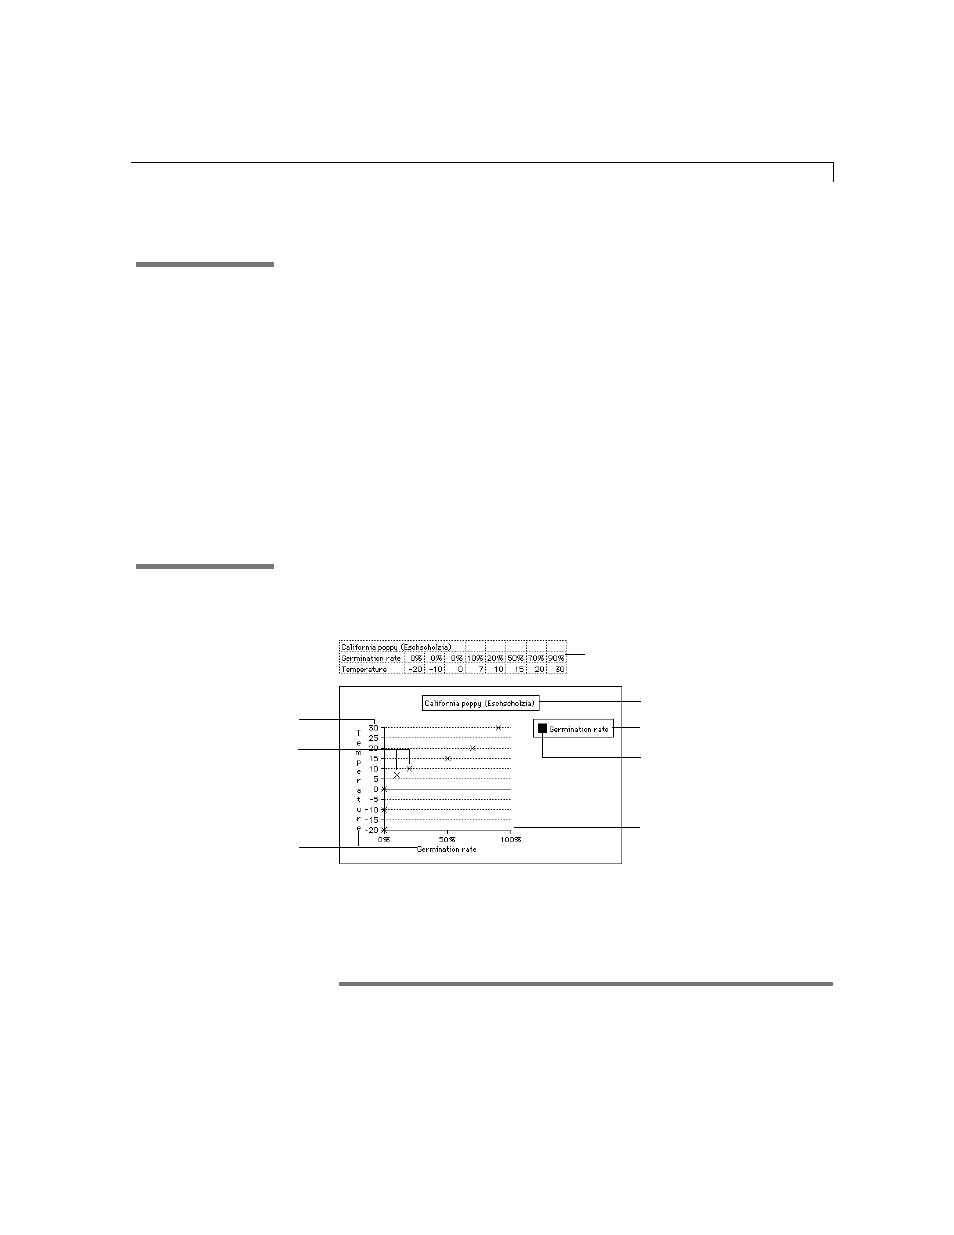
Changing chart options
You can change the way data is plotted as well as the appearance of a chart’s
elements (the title, axes, series, series labels, or series symbols). Each type
of chart (this one is an X-Y scatter chart) contains most of the same elements.
To revise an existing chart, double-click the chart, or select the chart and
choose Chart Options from the Edit menu.
*
Choose Index from the Help menu and type the first few letters of the entry. Double-click the
entry and then double-click a topic.
In the Help index,
*
see:
E
charts, creating
E
charts, modifying
In the Help index,
*
see:
E
charts, creating
Series symbols
Title
Legend
Y axis
X axis
Axes labels
Use this data to make the chart
Series box