Displaying data in charts (graphs) – Apple AppleWorks 5 : Windows 95/NT 4.0 User Manual
Page 162
7-28
AppleWorks 5 User’s Manual
3.
Choose Paste Function from the Edit menu.
4.
Select AVERAGE from the list and click OK.
5.
Hold down the mouse button and drag the I-beam pointer in the entry bar to
select the sample values between the parentheses.
6.
In the spreadsheet, hold down the mouse button and drag the pointer over the
three cells whose values you want to average, and then click to accept the
function.
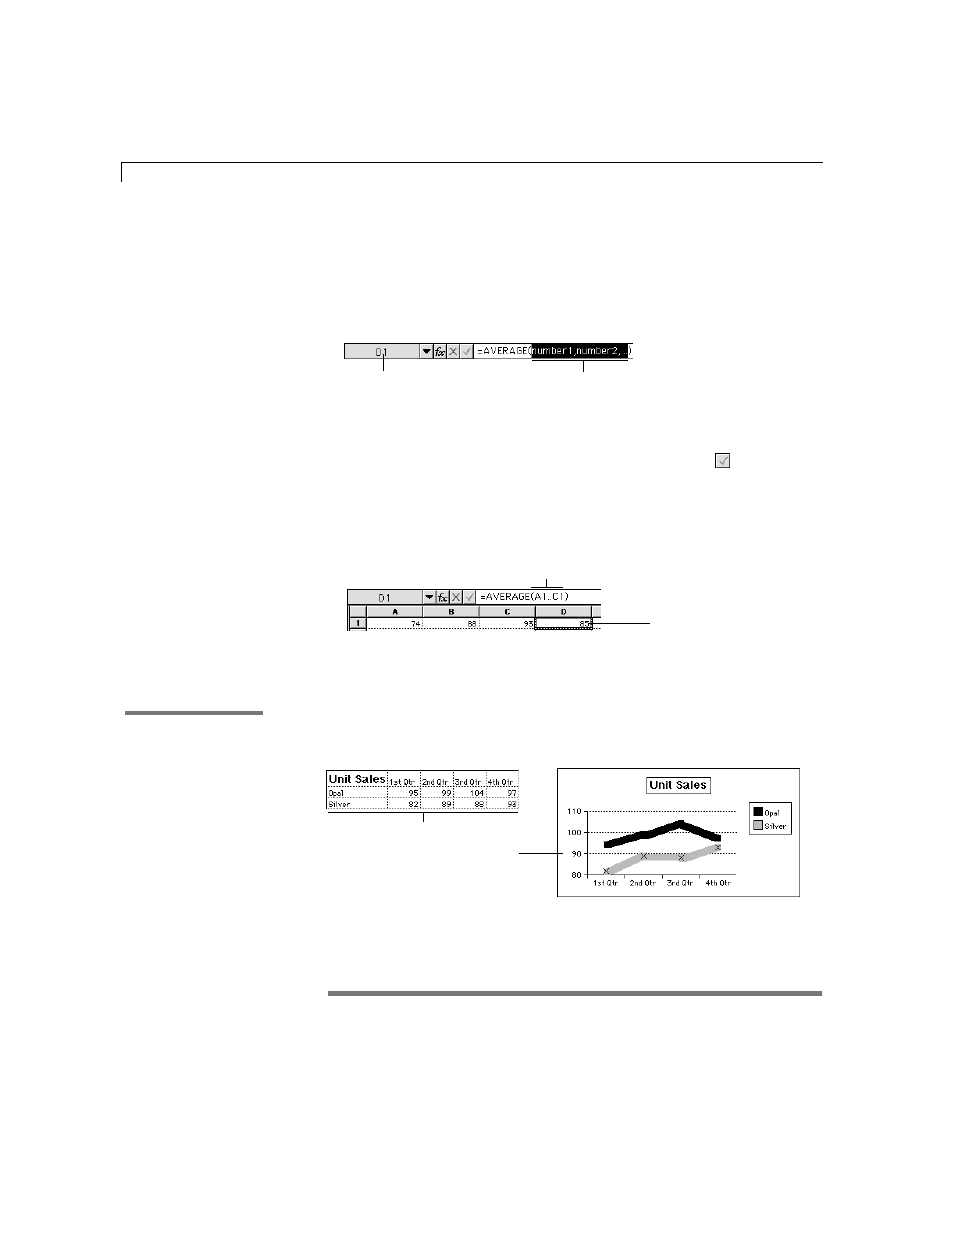
AppleWorks replaces the sample values with the selected cell range and
displays the average value (85) of the selected cells as the result.
Displaying data in charts (graphs)
A chart (or graph) shows graphic relationships and trends among data. You
can chart data in a spreadsheet frame as well as in a spreadsheet document.
*
Choose Index from the Help menu and type the first few letters of the entry. Double-click the
entry and then double-click a topic.
Select the sample values
but not the parentheses
Address of cell where
function is stored
Cell range
The result
In the Help index,
*
see:
E
charts, creating
Line chart
Data
- Numbers '09 (254 pages)
- Keynote '09 (247 pages)
- Pages '09 (279 pages)
- Boot Camp Mac OS X v10.6 Snow Leopard (18 pages)
- Boot Camp Mac OS X v10.6 Snow Leopard (19 pages)
- iWork '09 (372 pages)
- Mac OS X v10.6 Snow Leopard (7 pages)
- GarageBand '08 (102 pages)
- iDVD '08 (35 pages)
- GarageBand '09 (122 pages)
- iWeb (37 pages)
- iMovie '08 (50 pages)
- Boot Camp (Mac OS X v10.5 Leopard) (27 pages)
- Boot Camp (Mac OS X v10.5 Leopard) (25 pages)
- Mac OS X v10.5 Leopard (16 pages)
- Mac OS X (622 pages)
- Mac OS X Server (Version 10.6 Snow Leopard) (197 pages)
- Mac OS (42 pages)
- Mac OS X Server (Upgrading and Migrating For Version 10.4 or Later) (97 pages)
- iMovie HD (47 pages)
- iMovie HD (83 pages)
- MAC OS 7.6.1 (4 pages)
- Mac OS X Server (Extending Your Wiki Server For Version 10.5 Leopard) (45 pages)
- Mac OS X Server Ver 10.4 (35 pages)
- Mac OS X Server v10.6 (76 pages)
- Mac OS X Server v10.6 (97 pages)
- Macintosh Japanese Language Kit (30 pages)
- Xserve (Early 2008) DIY Procedure for Hard Drive (3 pages)
- Xserve (8 pages)
- Xserve (60 pages)
- GarageBand 3 (98 pages)
- Remote Desktop 3.1 (191 pages)
- Motion 5.1.1 (1090 pages)
- Workgroup Server 8150/110 (144 pages)
- Aperture (476 pages)
- Xserve Intel (Late 2006) DIY Procedure for Optical Drive Cable (7 pages)
- Xserve Intel (Late 2006) DIY Procedure for Optical Drive Cable (6 pages)
- Network Services Location Manager Network (8 pages)
- Macintosh System 7.5 (114 pages)
- Macintosh System 7.5 (65 pages)
- Macintosh System 7.5 (126 pages)
- DVD Studio Pro 4 (656 pages)
- Keynote '08 (204 pages)
- Xsan 2 (Second Edition) (11 pages)
- LiveType 2 (157 pages)