14 responsiveness, 14-1 overview, 14-2 description – HP Integrity NonStop H-Series User Manual
Page 75: Figure 61 response times, Plained in, Section 4-14, Of this
Using Event Analyzer
WVP Event Analyzer Plug-in User Guide V01 – 536989-001
- 75 -
4-14 Responsiveness
This section provides an explanation of the ‘Responsiveness’ screens. ‘Responsiveness’ refers to
the time taken to acknowledge an action-required event. This section explains the ‘Responsiveness’
screen showing the action event response time statistics.
4-14-1 Overview
The ‘Responsiveness’ screen can be reached at from the main screen (year grid), by clicking on the
link reading ‘Responsiveness’. This will bring up a new window that provides action event response
time statistics as well as details.
4-14-2 Description
These action event charts are displayed per day. The day selection control is located to the top right
corner of the screen. You can use the arrows to go back and forth or click within the field to bring up
the calendar.
There are two charts that can be displayed on action events. The selection between the two is done
using the selection options at the top of the screen.
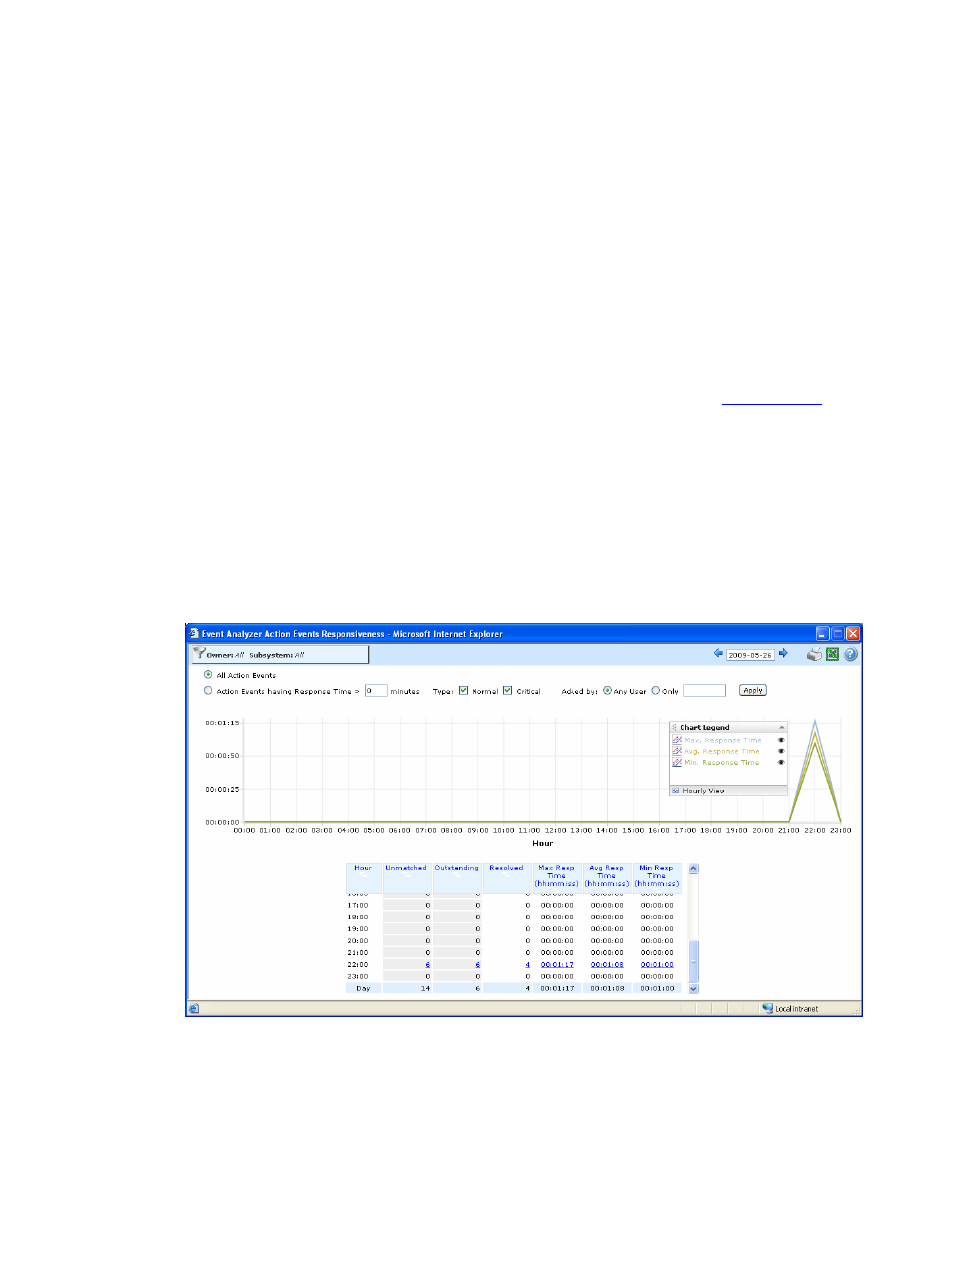
Figure 61 Response Times
The first option is to view the maximum, average and minimum response times for all action
events on that day. The chart is a line chart showing three lines – one each for the maximum,
minimum and average response times over the 24 hours of the day. Accompanying the chart is
a chart legend, which shows for each chart series, the name of the series as well as the color it
is identified by in the chart. This legend appears towards the right side of the chart. Rolling over
the lines of the chart brings up tooltips with details on the value being charted as shown below: