7 day drilldown – hourly, 7-1 overview, 7-2 description – HP Integrity NonStop H-Series User Manual
Page 59: Figure 45 day drilldown – hourly
Using Event Analyzer
WVP Event Analyzer Plug-in User Guide V01 – 536989-001
- 59 -
4-7 Day Drilldown – Hourly
This section provides an explanation of the ‘Hourly’ drilldown screen. The ‘Hourly’ view is an option
on the day drilldown. It lists the event counts for each hour of the chosen day.
4-7-1 Overview
The ‘Hourly’ screen is accessed from the main screen (yearly grid) by clicking on the day cell. It
appears as the first menu item in the drilldown menu that shows up.
4-7-2 Description
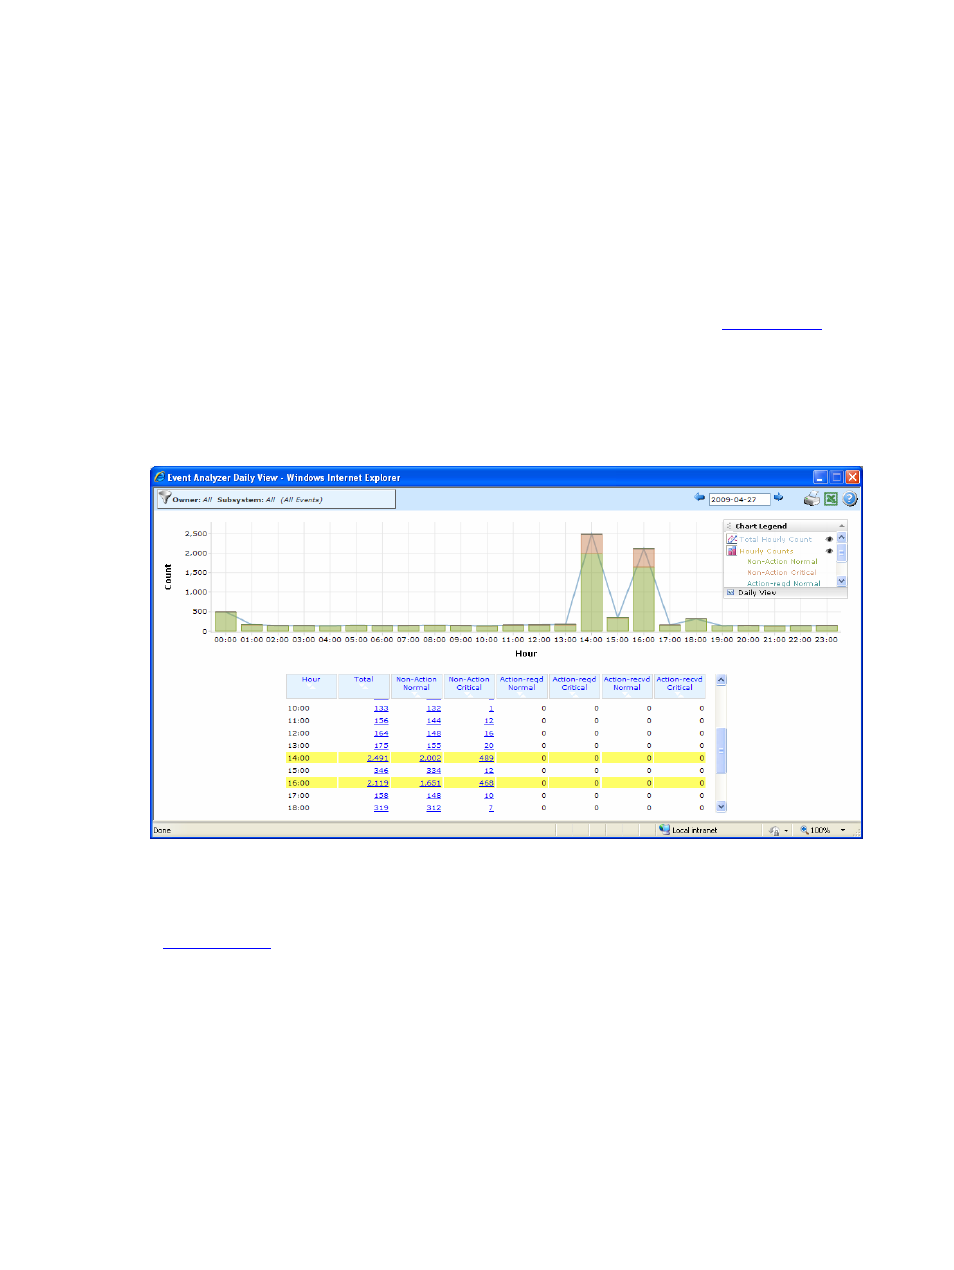
Figure 45 Day Drilldown – Hourly
This view shows the event counts for each hour of the day. The day selection control is located to the
top right corner of the screen. You can use the arrows to go back and forth or click within the field to
bring up the calendar. The toolbar on the left is the standard owner-subsystem-event # filter explained
in
(Toolbars) of this user manual. This filter is used to display events for a particular
owner-subsystem, a particular owner-subsystem-event # or an application.
The chart type is a stacked bar chart showing one bar for each of the 24 hours of the day, and shows
the activity for each hour, by event type/severity. Accompanying the chart is a chart legend, which
shows for each chart series, the name of the series as well as the color it is identified by in the chart.
This legend appears towards the right side of the chart. As can be seen from the chart legend, there
are six types of events: normal non-action, critical non-action, normal action-reqd, and so on. Each
type is represented by a different color on the chart. The blue line connecting the top of each bar
shows the total count for the hour. Rolling over the bars of the chart brings up tooltips with details on
the value being charted as shown below: