Changing time range for record retrieval, Event summary screen – HP XP Performance Advisor Software User Manual
Page 54

•
Description: A description of the event.
Double-click the text in the Description column to open the Event Summary screen. (If the Event Summary
screen does not automatically appear, it might be hidden behind the Event Log screen. Check the
task bar at the bottom of your screen.)
The information that appears in the Event Summary screen depends on the text that you double-clicked.
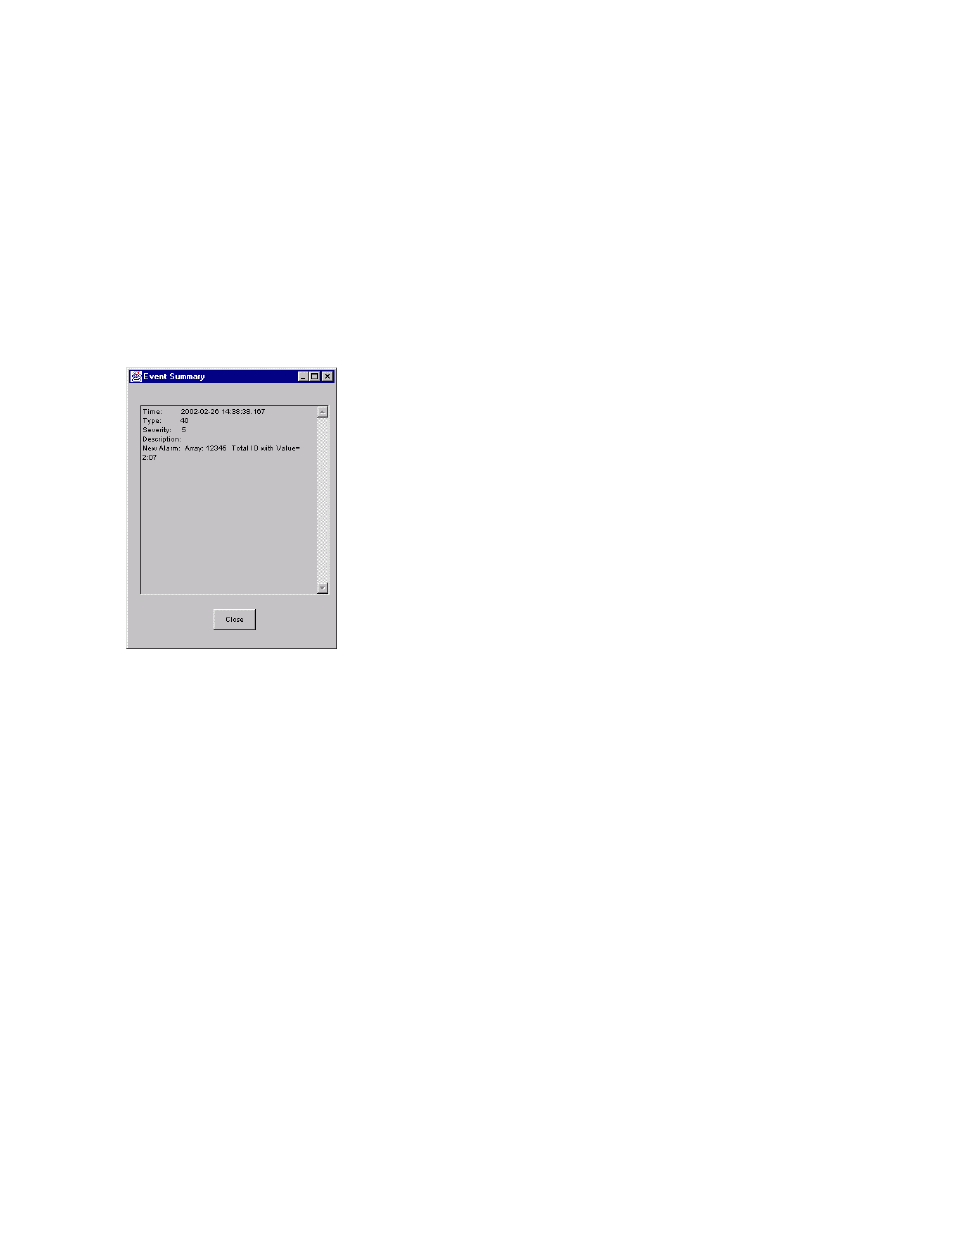
The Event Summary screen in
provides information about the configuration of a
new alarm, including the following:
•
The date and time (24-hour clock time) on the management server when the change was made
•
The type of change that occurred (40 means that an alarm was created)
•
A severity level of 5, which means the activity was instigated by the user (as opposed to, for
example, a system error)
•
A description of the event
In this case, it shows the serial number of the array on which the alarm was configured and the total IO.
Figure 25 Event Summary screen
You can customize the information that appears in the Event Log screen by using the drop-down menus
and buttons located in the lower portion of the screen. Use these components to filter the data the
system returns.
Changing time range for record retrieval
If you want to specify the range of time for the system to return information from the database, click Set
Times. The calendar appears, as shown in
54
Event Log
