Ldev io reports, Total backend i/o rate first top 8 ldevs report, Read/write detail – HP XP Performance Advisor Software User Manual
Page 138
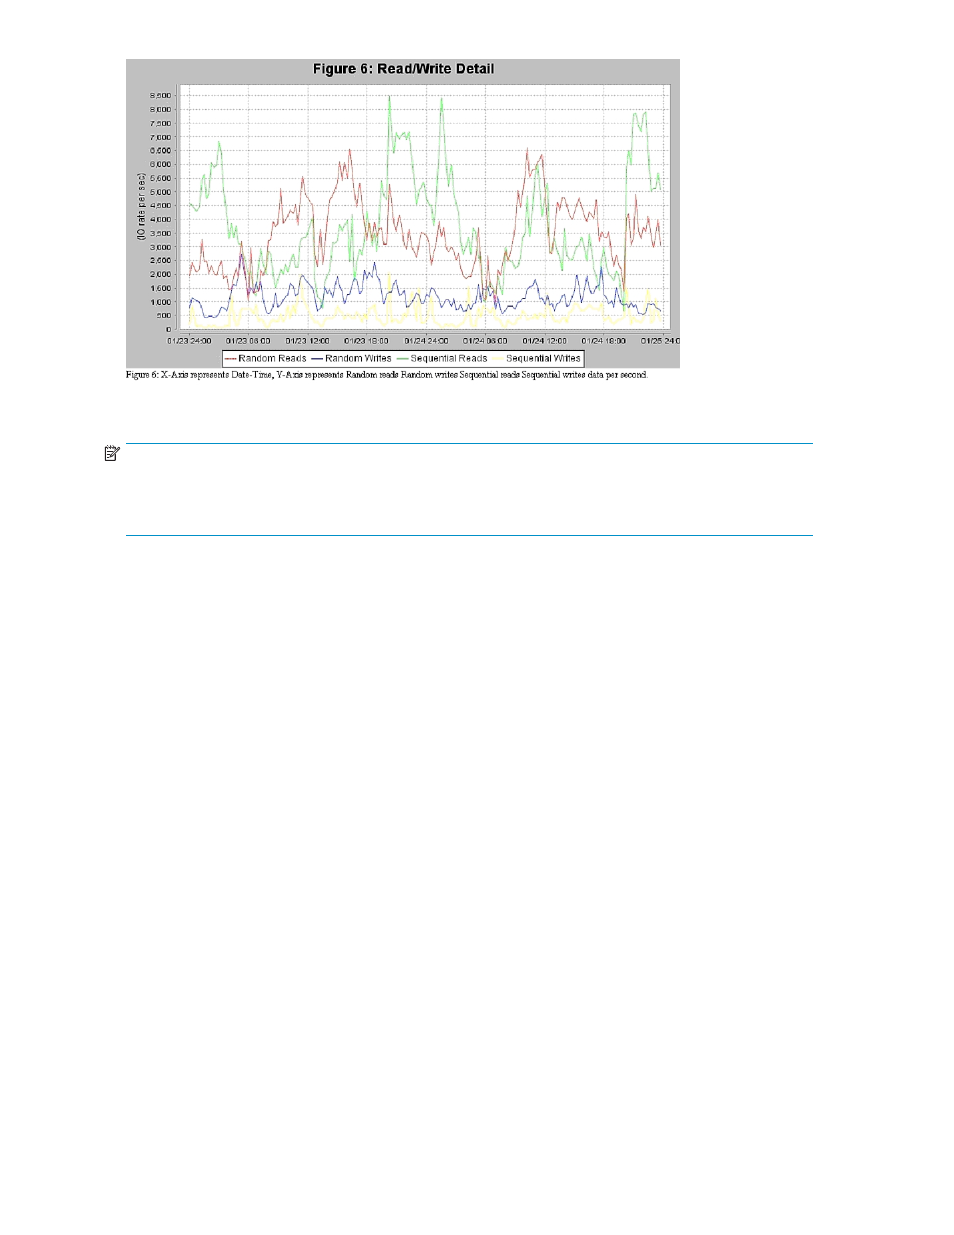
Figure 63 Read/Write Detail
NOTE:
If there are no data points available for the dates selected, blank chart will be displayed. If all the data
values are zero for the dates selected, a chart with a horizontal line along X axis will be displayed in
the center.
LDEV IO reports
LDEV I/O reports allow you to view the 8 busiest frontend and backend LDEVs and array groups, along
with the I/Os on them. There are 4 reports that can be generated to view this information, Total Backend
I/O Rate First Top 8 LDEVs, Total Backend I/O Rate First Top 8 Array Groups, Total Frontend I/O Rate
First Top 8 LDEVs, and Total Frontend I/O Rate First Top 8 Array Groups.
A sample of each report is given below:
Total Backend I/O Rate First Top 8 LDEVs report
The Total Backend I/O Rate First Top 8 LDEVs report shows in a chart format, the real backend I/O rate
of the busiest 8 LDEVs. This can be compared to the potential maximum throughput of the hardware. The
maximum throughput varies depending on RAID level and disk mechanism type and other factors such as
the size of the individual I/Os.
Total Backend I/O Rate First Top 8 LDEVs
shows a sample Total Backend
I/O Rate First Top 8 LDEVs report for XP1024.
138
Appendix B