E appendix e, Understanding charts, Chart start and end time – HP XP Performance Advisor Software User Manual
Page 155: Charts graph, Appendix e

E Appendix E
Understanding charts
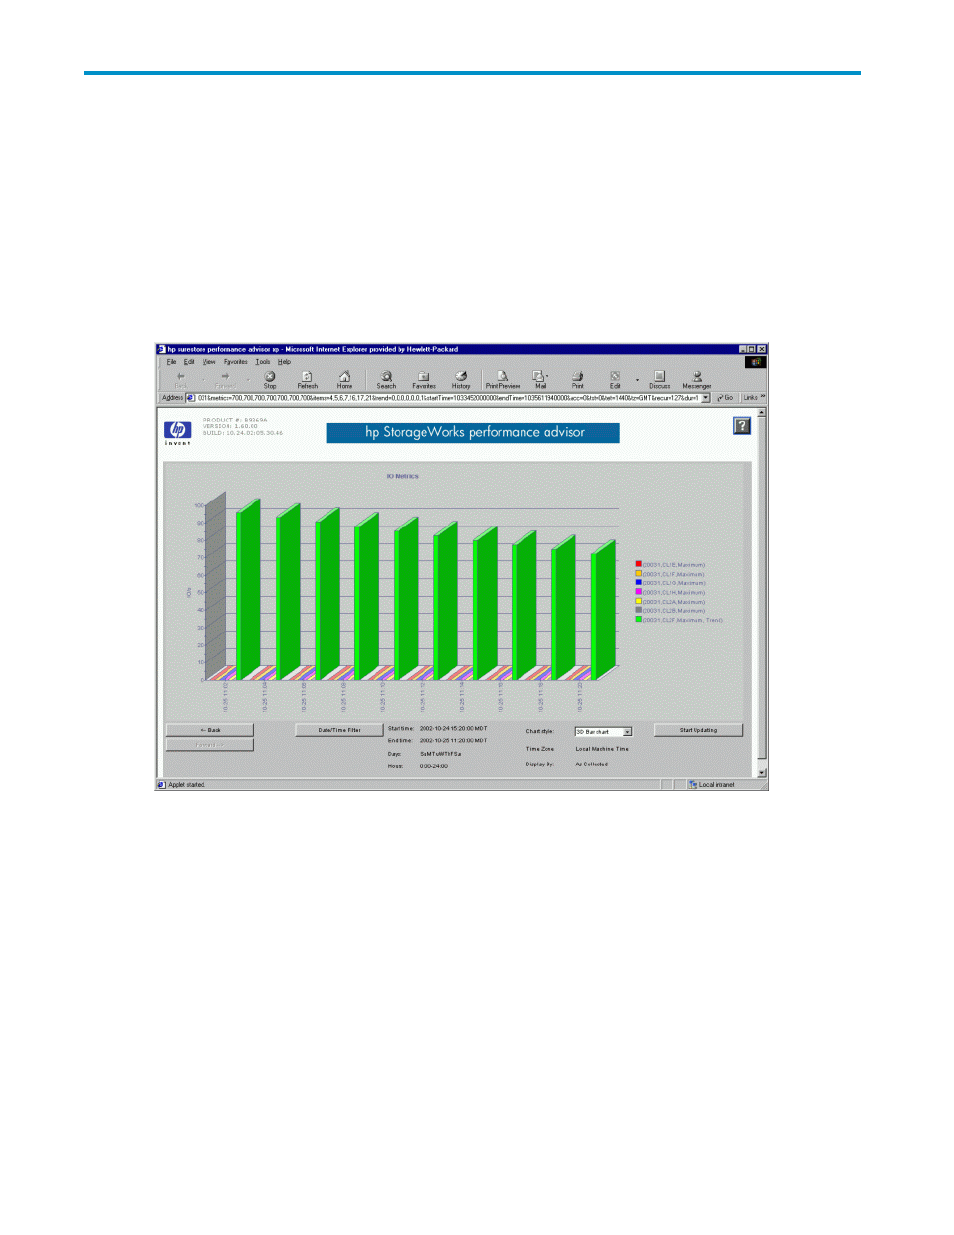
Charts display a color-coded graph of historical data. The
screen appears when you click
on Show Charts in the Charts screen or when you double-click an LDEV IO/s, LDEV MB/s, chip Util.,
ACP Pair ID, ACP Pair Util., Backend Transfer, Avg Read Resp(msec), Max Read Resp (msec)-valid
for last 30 secs, Avg Write Resp(msec), and Max Write Resp (msec)-valid for last 30 secs, (shown in
blue text) in the Grid Display screen.
Figure 84 Charts Graph
The data in the Performance History screen corresponds to the array component described in the header.
Each component is broken down into its corresponding subcomponents, and the data is displayed in a
bar chart, line chart, or stackable chart format. The subcomponents vary depending on the particular
component displayed. Some display formats might not be well-suited to some types of data.
The type of measurement displayed at the left of the bar graph depends on the component displayed
(for example, MB/s or IO/s).
Chart start and end time
For charts where data is present for the selected range, the start is the time of the first data point retrieved
in the selected range and the end time is the time of the last data point retrieved in the selected range.
For charts where data is not present for the selected range the start and end times is the time range
selected for which data is not displayed.
HP StorageWorks Performance Advisor XP Software user guide
155
