General Tools and Instruments GTi10-20-30-50 User Manual
Page 112
46
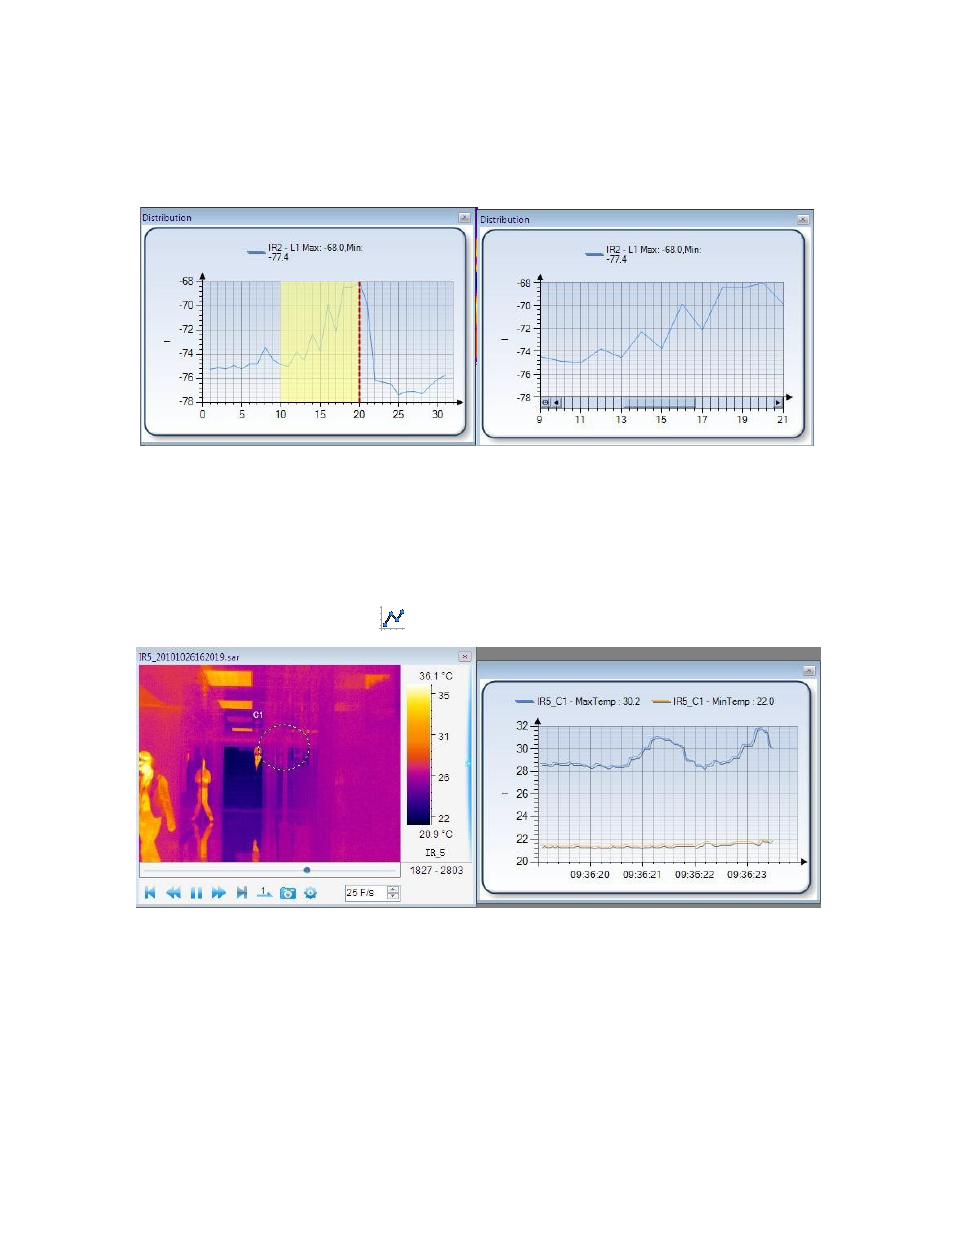
Left click and hold mouse button at a point of the distribution chart;
Move mouse cursor to left or right of shown red line to select a range that appears in yellow;
Release the mouse button, the selected range of distribution or partial distribution will be shown;
You can repeat above steps to zoom in the distribution.
You can click minus circle at lower left corner of the chart to zoom out the partial distribution.
6.2. Trend
For the USB, NET or ALL version, you can generate trends of maximum and minimum temperature
from a thermal record or monitor. You also can generate trends of max and min temperature of
whole image, points, lines, or areas from a thermal record or monitor.
Action: select menu Tools=>Analysis Chart=>Trend or right click mouse on a thermal image =>Analysis
Chart =>Trend or click the shortcut
=> click Play button.
X coordinate indicates current time; Y coordinate indicates temperature.
Partial Trend:
Left click and hold mouse button at a point of the trend chart;
Move mouse cursor to left or right of shown red line to select a range that appears in yellow;
Release the mouse button, the selected range of trend or partial trend will be shown;
You can repeat above steps to zoom in the trend.