2 device icon colors, 3 system message panel alarm status – ZyXEL Communications 1 User Manual
Page 46
NetAtlas Enterprise 1.00 User’s Guide
45
Chapter 2 EMS Main Window
The following table describes the elements in the EMS screen.
Table 4 EMS Main Screen Overview
ELEMENT
FUNCTION
Menu Shortcut Bar
Use these buttons to execute common commands quickly. Hold the cursor
over an icon to see a tool tip.
Device Panel
This is a graphical device display. Double-click on a switch to display the
EMS GUI management window for the switch.
Device List Panel
View devices in a tree structure. The colors of the device icons indicate the
real-time status of the represented devices.
System Message Panel
View the alarm status and port status of the selected switch.
2.2 Device Icon Colors
The colors of the device icons (in the Device List Panel) indicate the real-time status of the
represented devices. The following table describes the colors used.
Table 5 Device Icon Colors
COLOR
DESCRIPTION
Green
The device is working and is responding to polling.
Red
There is no response from the device or the device is not turned on.
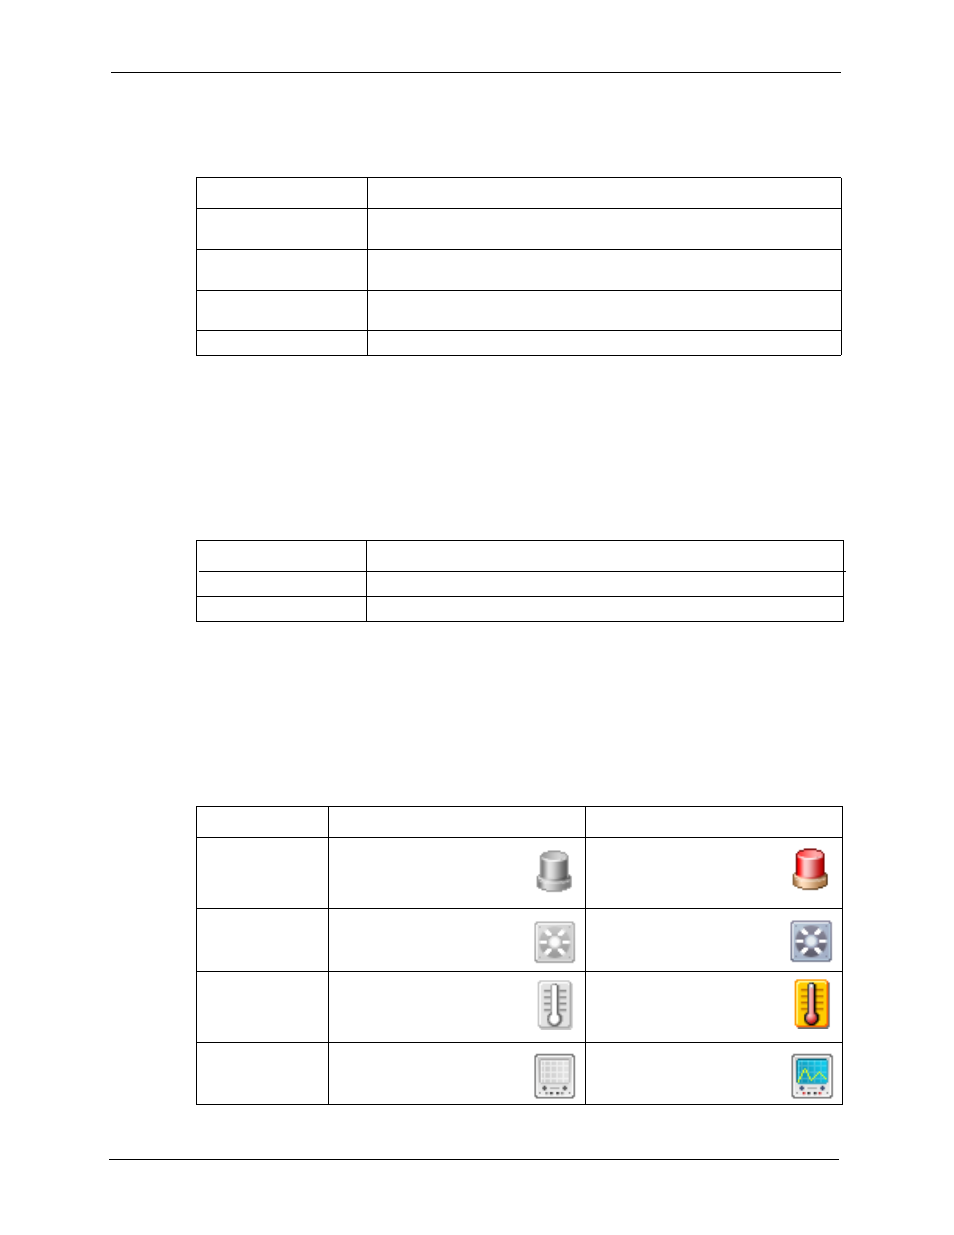
2.3 System Message Panel Alarm Status
The colors of the alarm icons (in the System Message Panel) indicate the real-time status of
the the current selected device. The following table describes the alarm states used.
Table 6 System Message Panel Alarm Status
PANEL ALARMS
ALARM OFF
ALARM ON
ALARM
The device fan, temperature
or voltage alarm is off.j
The fan, temperature and
voltage alarms are all on. A
serious hardware problem
exists.
FAN
The device fans are
functioning properlyj
One or more of the device
fans has a problem.
TEMP
Temperatures at all sensor
points in the switch are within
the threshold temperature
range.
The temperature at a sensor
point in the switch has risen
above or below the threshold
temperature range.
VOL
The power supply at all
sensor points in the switch is
within the tolerance range.
The power supply at a sensor
point in the switch has fallen
out of tolerance range.