How to set up and interpret the p3 display, Spectrum display – Elecraft P3 High-Performance Panadapter Manual User Manual
Page 18
18
How to Set Up and Interpret the P3 Display
There are several options to customize the layout of
your P3 display.
D I S P L A Y
switches between a
spectrum-only and spectrum-plus-waterfall display.
The height of the waterfall can be adjusted with
MENU:Waterfall
. The function (FN) key labels
appear at the bottom of the screen by default. You
can hide them to maximize the screen area by
holding
L AB E L S
. The FN keys remain active even
when the labels are hidden. Another trick to
maximize viewing area is to choose a smaller type
font via
MENU:Font
.
Spectrum Display
The spectrum display on a panadapter is similar to
the display on a laboratory spectrum analyzer. The
horizontal axis is frequency and signal strength is
represented by the vertical height of each signal.
The P3's spectrum display is similar to most in that
the signal height is proportional to the logarithm of
the amplitude, represented in decibels (dB). Each 3
dB represents a doubling of power and 10 dB
means ten times the power.
The vertical scale at the left edge of the spectrum
display may be in units of dBm or S-units, as
selected by MENU:Lvl Mode. The dBm unit
means decibels with respect to one milliwatt. 0
dBm is one milliwatt, +10 dBm is 10 milliwatts, -10
dBm is 1/10 milliwatt and so on. An S9 signal is
normally considered to be 50 microvolts into 50
ohms, which is -73 dBm, an easy number for a ham
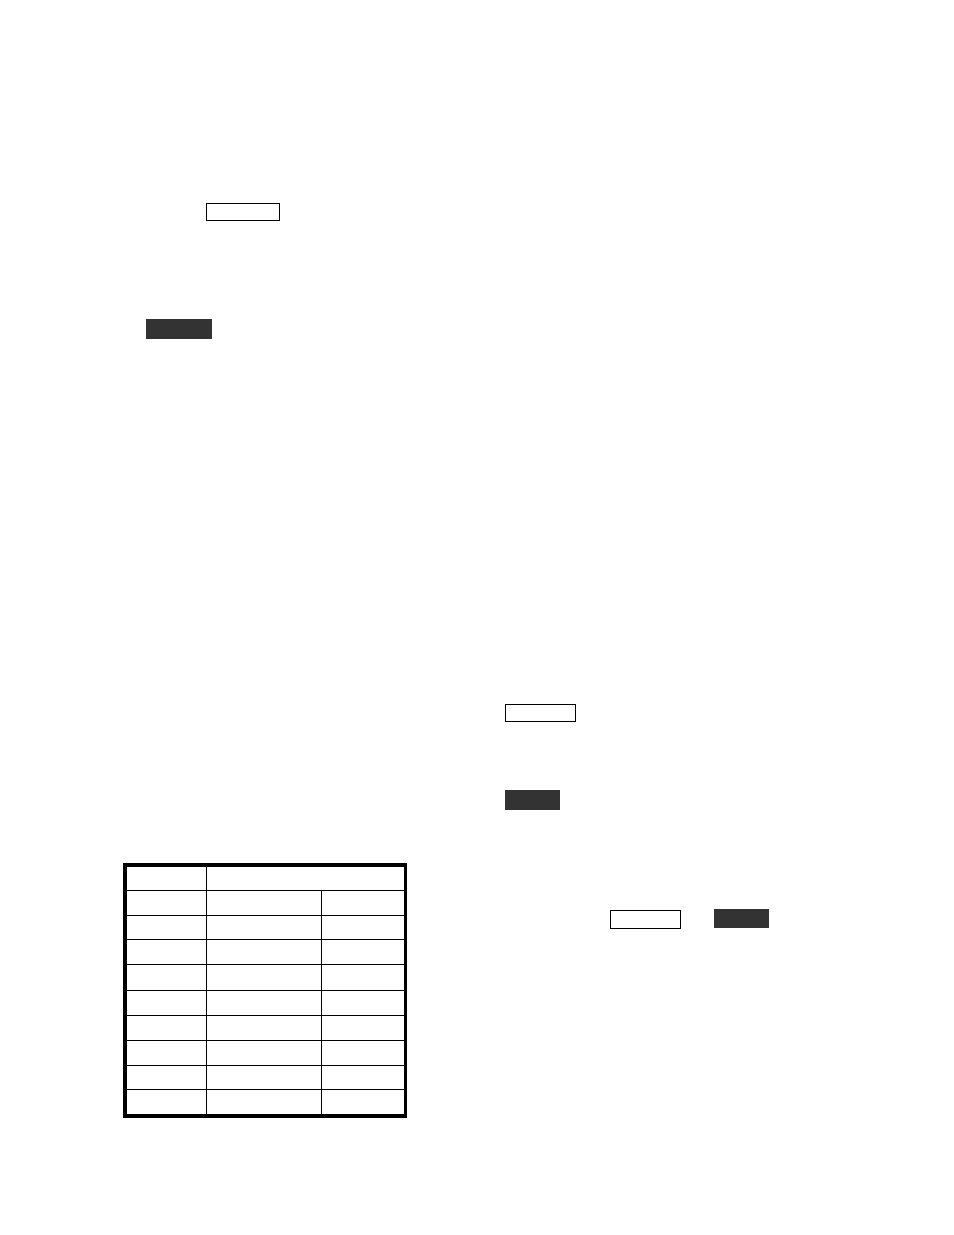
to remember! Assuming the standard 6 dB per S-
unit, the following table applies.
S-Units Signal
Level
S9
-73 dBm
50 V
S8
-79 dBm
25 V
S7
-85 dBm
12.5 V
S6
-91 dBm
6.25 V
S5
-97 dBm
V
S4
-103 dBm
1.56 V
S3
-109 dBm
0.78 V
S2
-115 dBm
0.39 V
S1
-121 dBm
0.2 V
You would expect the S meter on the K3 and the
signal on the P3 display to indicate the same level if
both the K3 and the P3 are properly calibrated,
however there are several reasons why that might
not be the case. One is that the P3 is not affected by
the preamplifier and attenuator in the K3. If the K3
CONFIG:SMTR MD
is set to
NOR
, the S meter
reading changes when you turn on or off the
preamplifier and attenuator. To prevent that,
change the setting to
ABS
.
The noise level will generally be lower on the P3
display compared to the K3 S meter. The reason is
that the effective bandwidth of the P3 is generally
one display pixel, which is approximately span /
450. The smaller the bandwidth, the less noise. For
example, if the span is 45 kHz, the effective P3
bandwidth is 45,000 / 450 = 100 Hz. If the K3
bandwidth is 400 Hz, it will show a 6 dB (one S-
unit) higher noise level than the P3.
A similar thing happens with spread-out signals like
SSB. Even at the maximum 200 kHz span, the P3's
effective bandwidth is only about 440 Hz so that
not all the SSB signal is within one pixel. That's
why the P3 tends to read a lower level on SSB
signals than the K3 S meter.
R E F L V L
(reference level) on the P3 shifts all the
signals up or down. The level that you are adjusting
is the signal level at the bottom of the display,
measured in dBm.
S C AL E
is used to expand or contract the vertical
scale. Think of it as a vertical gain control. The
scale is defined as the dB difference between the
top and the bottom of the display. For example, if
the reference level is -100 dBm and the scale is 20
dB, then a signal at the top of the display is at -80
dBm. For both
R E F L V L
and
S C AL E
, turning the
knob clockwise makes the signals taller.
The P3 automatically compensates for the
preamplifier and attenuator in the K3. When you
turn them on or off, the signal levels on the P3
should stay the same. If the I.F. output modification
has been done on the K3 (see note at the top of
page 5), the indicated dBm level should be the
signal level at the K3 antenna input. Perhaps
counter-intuitively, this means that if you turn on