Rockwell Automation 5370-UPK CVIM USER-PAK Option User Manual
Page 75
Chapter 7
Creating Custom Runtime Displays
7–24
Note these additional considerations when setting
Upper
and
Lower
limits:
•
The
limits you set are for the
Graph
viewport itself, and therefore
encompass all variables plotted in the viewport. You cannot set
Upper
and
Lower
limits ranges for each variable individually. Therefore, be
sure to accommodate the results of all variables you are plotting when
setting the
Upper
and
Lower
limits.
•
Results which go beyond the
Upper
limit are plotted along the top of the
viewport. Results which go beyond the
Lower
limit are plotted along the
bottom of the viewport.
To set either the
Upper
or
Lower
limit:
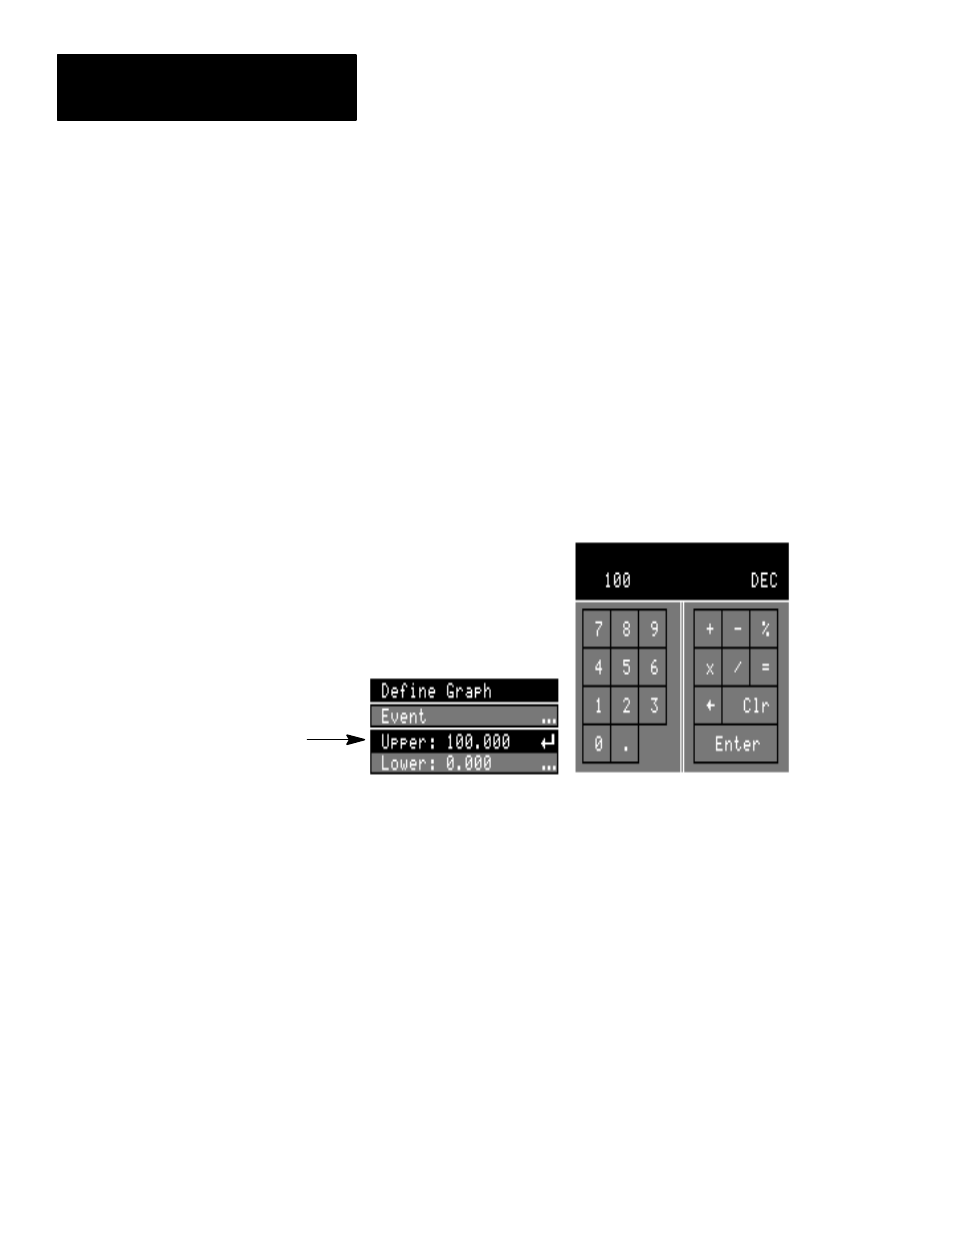
•
Pick the
Upper
or
Lower
box, as appropriate, on the
Define Graph
menu, which causes the calculator pad to appear.
•
Use the calculator pad to enter the range limit.
Calculator Pad
Upper
box
Valid Range: The valid range for the
Upper
and
Lower
limits are
–32767 to 32767, and the difference between the two limits must not
exceed 32767. If you try to enter a number which is not valid, such as a
Lower
limit value which is higher than the current
Upper
limit, the
calculator pad will flash the message –
Value Out of Range.
Defining the
Event
For each
Graph
viewport you define, you must specify the
Event
. In
defining the event, you are defining the conditions which must be met, upon
completion of an inspection, in order for the
Graph
viewport variables to be
updated. You define the event using the
Event
menu. See Chapter 8 for
more information on setting the
Event
.
For example, the default setting specifies that the
Graph
viewport is always
updated upon completion of an inspection. You can define other conditions –
you can specify that the viewport is updated every 100 inspections, for
example.