Defining graph viewports – Rockwell Automation 5370-UPK CVIM USER-PAK Option User Manual
Page 69
Chapter 7
Creating Custom Runtime Displays
7–18
This section discusses how to define
Graph
viewports.
Graph
viewports
provide the capability to display in real time, and in graph form, the results
from gages, windows, and/or formulas.
Graph
viewport contents are
displayed during run mode in a bordered area, for which the border,
background, and graph colors are user–defined.
For each
Graph
viewport you create, you can define up to three “variables,”
that is, three different graph lines. A “variable” represents the numerical
results of a specific gage, window or formula that you select. These results
are plotted in the
Graph
viewport within a range you define.
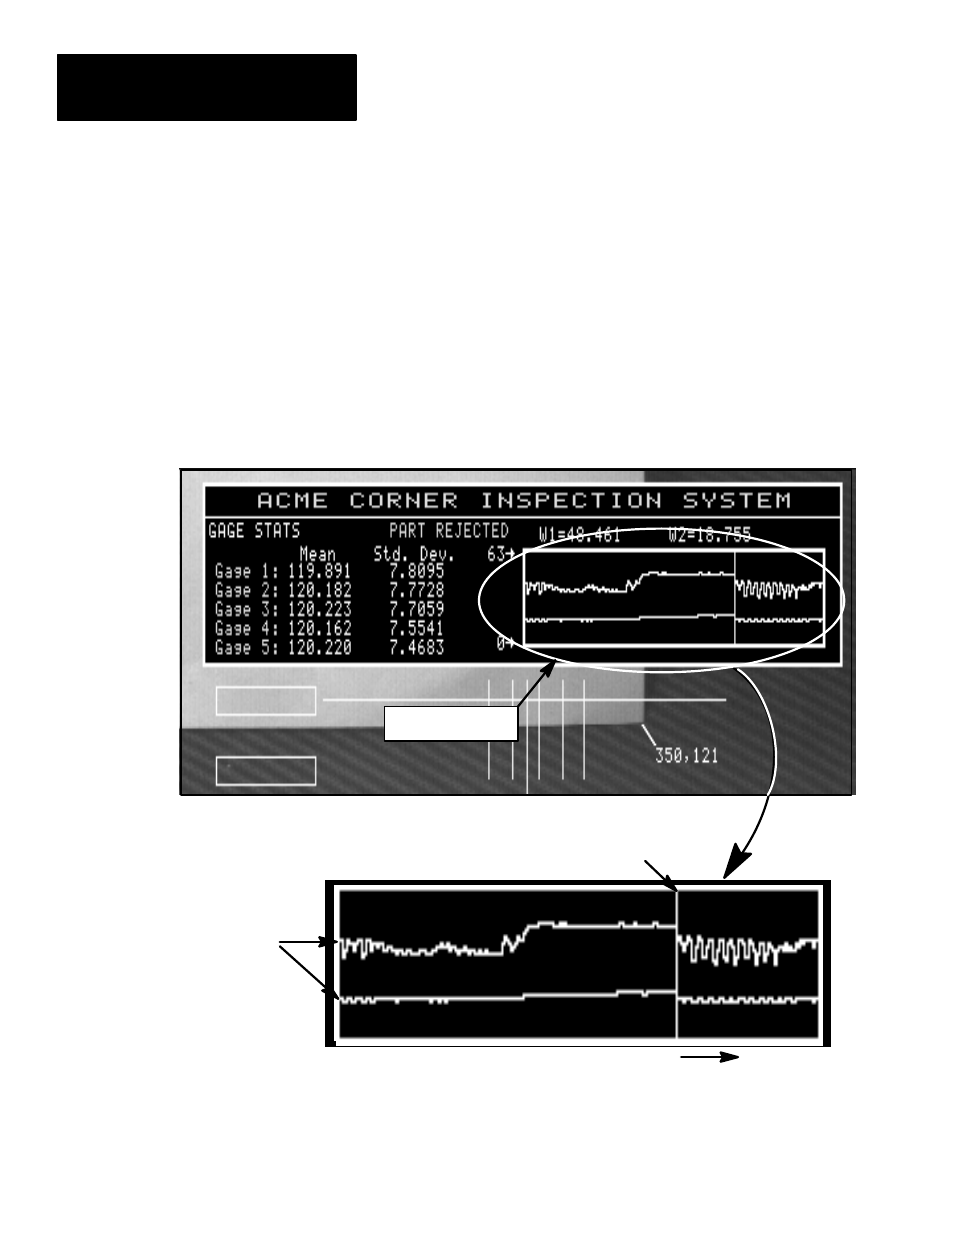
Shown in the illustration below is a typical example of a
Graph
viewport
displayed during run mode, which is shown plotting two variables (the
results of windows 1 and 2, in this case) within the range of 0–63:
Current position indicator
Two variables being plotted
Graph Viewport
When the
Graph
viewport is displayed during run mode, the defined
variables are plotted from left to right; plotted variables are either line or dot
style (as defined), and the leading edges of the plotted variables are
emphasized by the “current position indicator,” a vertical line spanning the
viewport. During run mode, the current position indicator moves from left to
Defining
Graph
Viewports