Selecting the variable – Rockwell Automation 5370-UPK CVIM USER-PAK Option User Manual
Page 70
Chapter 7
Creating Custom Runtime Displays
7–19
right as the variables are plotted from left to right (Note: The plotting of
variables cannot be observed during setup mode).
The basic steps for defining a
Graph
viewport are as follows:
•
Complete preliminary steps for defining a viewport. See “Initial Setup:
Selecting and Defining the Viewport,” near the beginning of this chapter,
for more information.
•
Select which of three variables (1, 2, or 3) you wish to define, using the
Next
or
Previous
box (located beneath the
Define Graph
box).
•
Using the
Define Graph Var.
menu, define the variable:
−
Enable the variable and set the graphing
Style
–
Line
or
Dot
.
−
Select the variable tool – the specific gage, window, or formula
number whose results will be tracked by the graph viewport.
−
Set the variable color (the color of the plotting in the
Graph
viewport
for the respective variable).
•
Using the
Define Graph
menu, define the
Event
, or circumstances under
which the graph variable plottings are updated, and set the
Upper
and
Lower
parameters for the range of the
Graph
viewport.
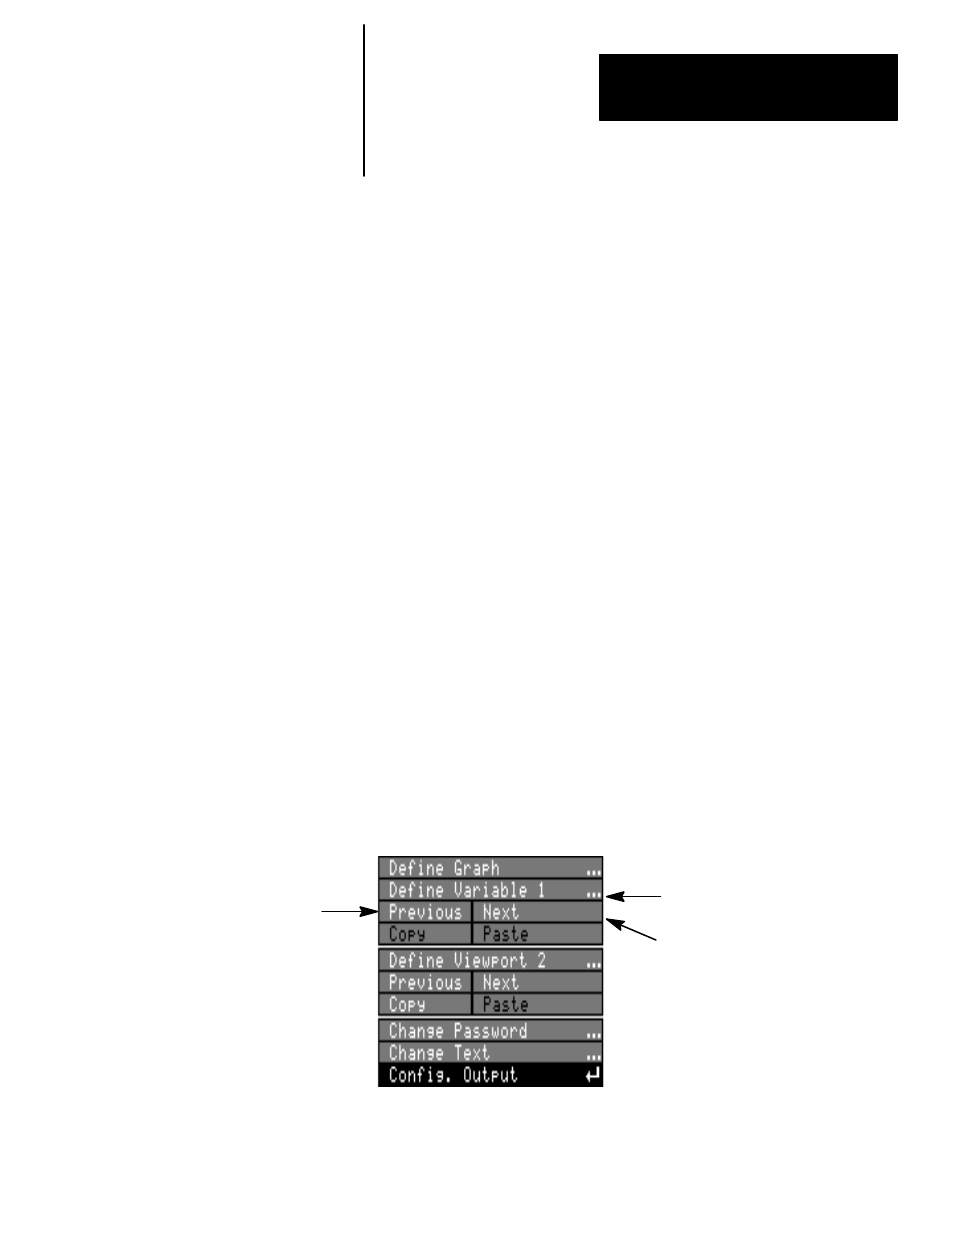
Selecting the Variable
You can define from one to three variables for the
Graph
viewport.
To select the variable you wish to define:
•
Pick the
Next
or
Previous
box (located beneath the
Define Variable
box):
Variable 1 selected
Next box
Previous box