11 fast fourier transform examples, Example without bin averaging – Campbell Scientific CR23X Micrologger User Manual
Page 125
SECTION 8. PROCESSING AND PROGRAM CONTROL EXAMPLES
8-15
8.11 FAST FOURIER TRANSFORM
EXAMPLES
8.11.1. EXAMPLE WITHOUT BIN AVERAGING
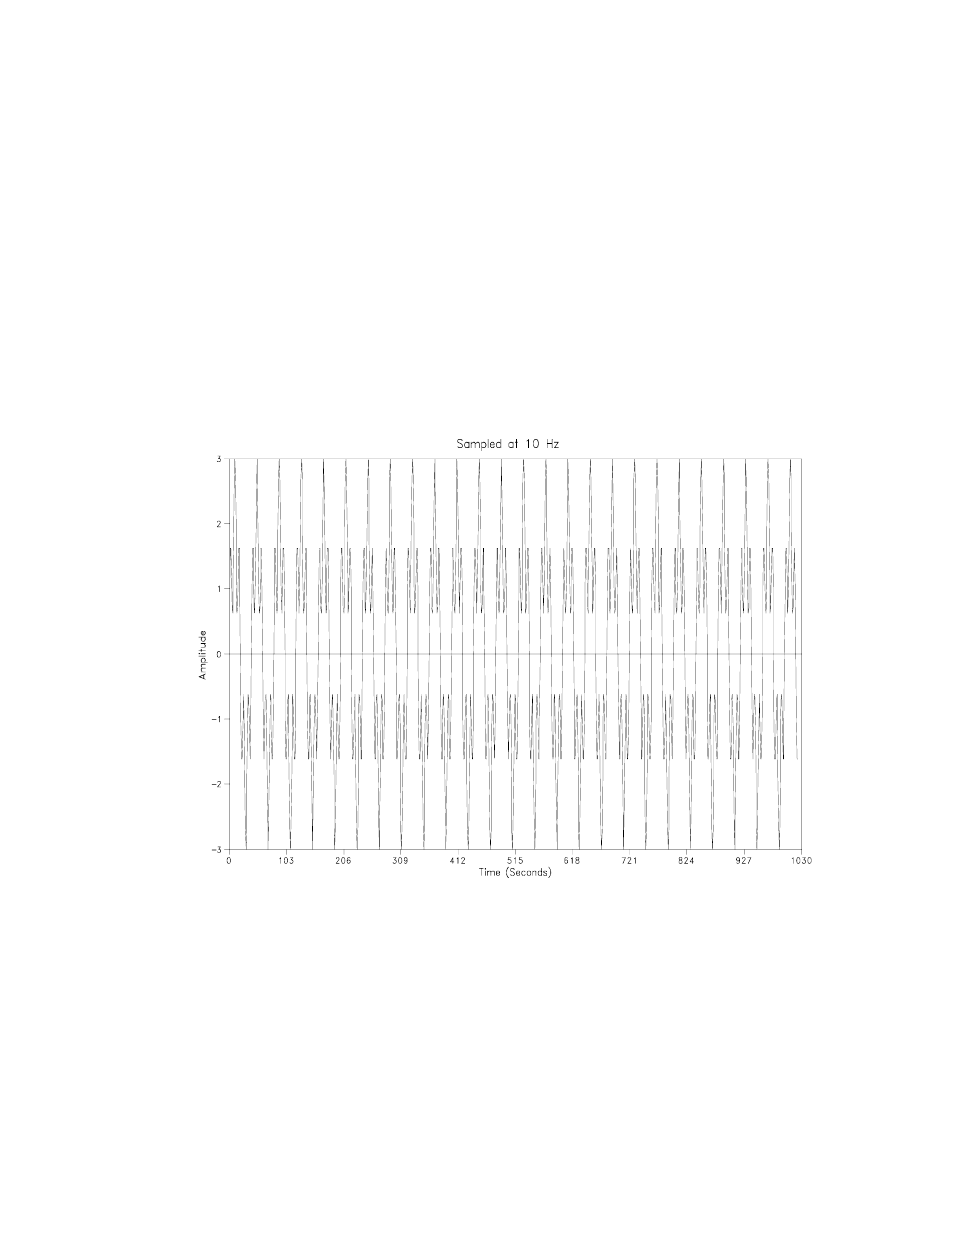
The CR23X was used to generate data
representing two superimposed sine wave signals,
one at 1.25 Hz (amplitude = 1) and the other at
0.25 Hz (amplitude = 2). The 1024 generated
samples simulate a sampling rate of 10 Hz or a
0.1 second scan rate. Figure 8.11-1 shows a plot
of the simulated signal. The FFT was applied to
the data and the real and imaginary, phase and
magnitude, and the power spectra results are
shown in Tables 8.11-1, 8.11-2, and 8.11-3
respectively. A portion of the power spectra
results are illustrated in Figure 8.11-2.
The phase of the cosine wave that describes the
signal at the beginning of the first interval and
the end of the last interval can be determined by
looking at the CR23X program that generated
the "original time series data". The 1.25 Hz
signal began and ended at 270 degrees
[cos 270 = cos(0 - 90) = sin 0]. The 0.25 Hz
signal began at 270 degrees and ended at 126
degrees. The phases of the 1.25 and 0.25
signals are 270 and 198 respectively (Table
8.11-2).
FIGURE 8.11-1. Simulated 1.25 and 0.25 Hz Signals