Understand the performance metrics – HP Neoview Release 2.4 Software User Manual
Page 78

Related Topics
“Configure System Monitor Options” (page 82)
“Understand the Performance Metrics” (page 78)
“Understand the System Status Icons” (page 80)
Terms
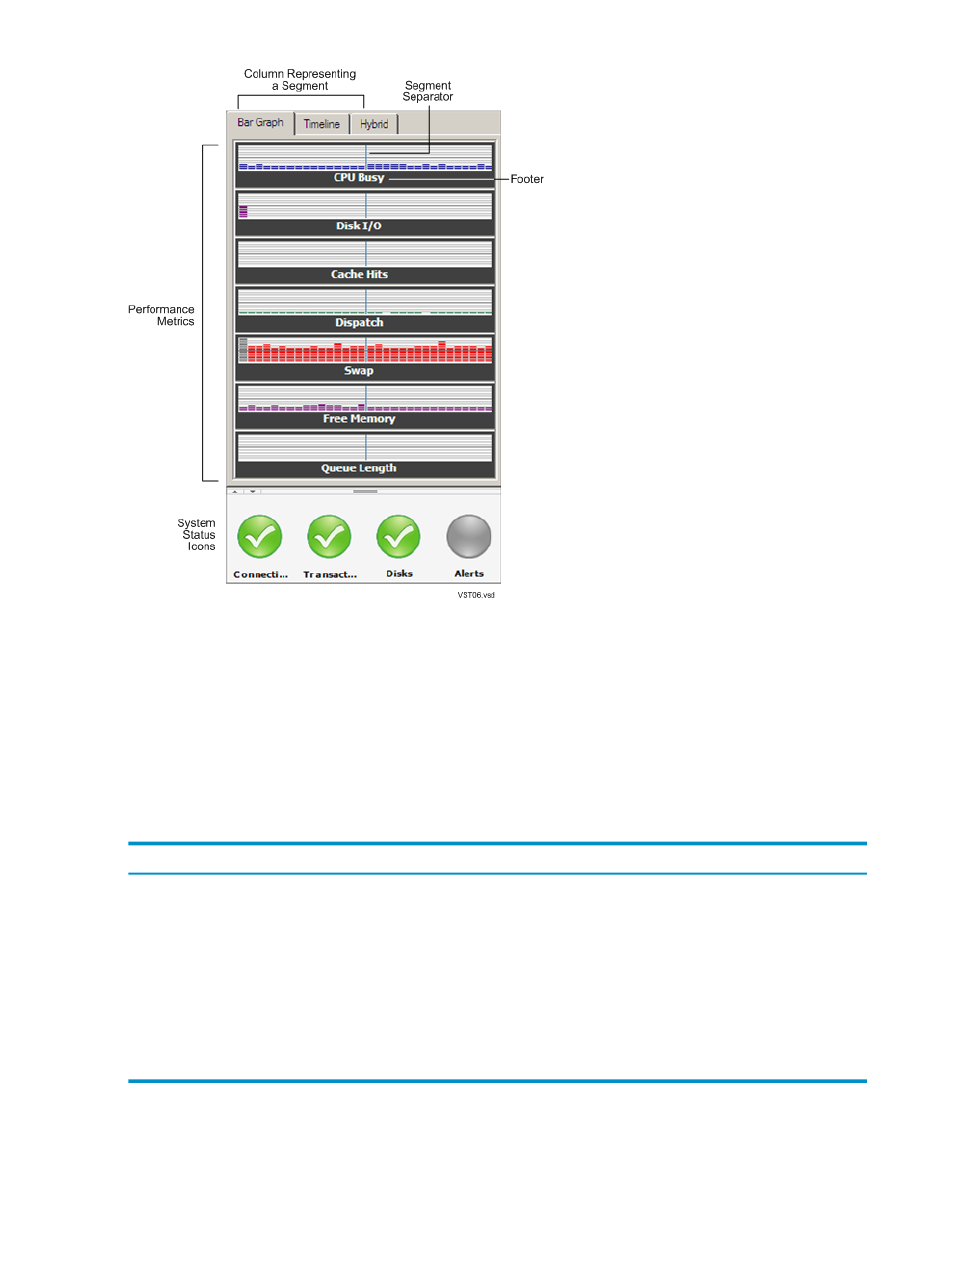
Understand the Performance Metrics
The system monitor shows seven performance metrics:
Description
Metric
The average busy value of the specified processing node (CPU) over the last refresh interval.
CPU Busy
The average number of disk I/O operations over the last refresh interval.
Disk I/O
The average number of cache accesses over the last refresh interval.
Cache Hits
The average number of process-context switches over the last refresh interval.
Dispatch
The average number of page faults (swaps) over the last refresh interval.
Swap
The amount of free memory currently available (in megabytes).
Free Memory
The number of processes currently waiting to be dispatched (on the ready queue).
Queue Length
The default refresh rate for all performance metrics is 2 seconds. However, the refresh rate is
configurable. See
“Configure System Monitor Options” (page 82)
Related Topics
“Configure System Monitor Options” (page 82)
78
Use the System Monitor
- Scripting Toolkit for Linux (68 pages)
- Scripting Toolkit for Windows 9.50 (62 pages)
- Scripting Toolkit for Windows 9.60 (62 pages)
- Storage Area Manager (13 pages)
- Core HP-UX (5 pages)
- Matrix Operating Environment Software (138 pages)
- Matrix Operating Environment Software (137 pages)
- Matrix Operating Environment Software (97 pages)
- Matrix Operating Environment Software (33 pages)
- Matrix Operating Environment Software (142 pages)
- Matrix Operating Environment Software (189 pages)
- Matrix Operating Environment Software (58 pages)
- Matrix Operating Environment Software (79 pages)
- Matrix Operating Environment Software (68 pages)
- Matrix Operating Environment Software (223 pages)
- Matrix Operating Environment Software (136 pages)
- Matrix Operating Environment Software (34 pages)
- Matrix Operating Environment Software (63 pages)
- Matrix Operating Environment Software (67 pages)
- Matrix Operating Environment Software (104 pages)
- Matrix Operating Environment Software (128 pages)
- Matrix Operating Environment Software (75 pages)
- Matrix Operating Environment Software (245 pages)
- Matrix Operating Environment Software (209 pages)
- Matrix Operating Environment Software (71 pages)
- Matrix Operating Environment Software (107 pages)
- Matrix Operating Environment Software (239 pages)
- Matrix Operating Environment Software (77 pages)
- Insight Management-Software (148 pages)
- Matrix Operating Environment Software (80 pages)
- Insight Management-Software (128 pages)
- Matrix Operating Environment Software (74 pages)
- Matrix Operating Environment Software (132 pages)
- Matrix Operating Environment Software (76 pages)
- Matrix Operating Environment Software (233 pages)
- Matrix Operating Environment Software (61 pages)
- Matrix Operating Environment Software (232 pages)
- Matrix Operating Environment Software (70 pages)
- Matrix Operating Environment Software (120 pages)
- Matrix Operating Environment Software (36 pages)
- Matrix Operating Environment Software (99 pages)
- Matrix Operating Environment Software (192 pages)
- Matrix Operating Environment Software (198 pages)
- Matrix Operating Environment Software (66 pages)
- Matrix Operating Environment Software (95 pages)
